
Salesforce Flows can automate core critical business tasks but, as they are difficult to review and test, they are often prone to failure. When Flows do fail, they block your end users from carrying out business-critical processes — like a sales team losing the ability to create a new opportunity. Keeping a dedicated eye on Flow errors is critical — it means your team can spot these specific problems quickly, fix them before they cause bigger issues, and help ensure your automations and overall Salesforce setup stay reliable.
In this post we’ll explore Salesforce Flows and their common errors, and walk through how Gearset’s Flow error monitoring makes it easy to visualise and manage your Flows.
What are Salesforce Flows?
Flows allow Salesforce teams to automate complete business processes, without writing code. Instead of relying on Apex triggers and classes for everything, you can build sophisticated logic in Salesforce using Flow Builder’s visual, drag-and-drop interface. There are lots of different Flow types, including:
Screen Flows create custom screens that collect information from users, guide them through a process, and update records based on their input. These Flows use screen elements like text fields and picklists.
Record-Triggered Flows launch automatically whenever a record is created, updated, or deleted. Teams use them to enforce business rules, update related records, or send notifications.
Schedule-Triggered Flows run at a specified time and are ideal for batch updates, data cleanup, or generating reports.
Platform Event-Triggered Flows are triggered by events on platforms that exist outside of Salesforce, allowing for powerful integrations with other systems.
Autolaunched Flows don’t have a user interface and are called by other automation tools like Process Builder, Apex code, or even other Flows.
Their easy building process and flexibility mean that Flows are popular for teams wanting to implement more automation, but they also come with specific challenges.
TDX
Why are Flows prone to errors?
Although Flows are powerful, they’re prone to issues. Here’s why:
Complexity: Just because you’re not writing code doesn’t mean the logic is simple. Flows can become very complex, with many decision points, loops, and data calls. The more complex a Flow, the higher the chance of errors.
Data dependency: Flows rely heavily on the data in your Salesforce org. If the data is incomplete, incorrect, or changes unexpectedly, the Flow will fail. Any changes to your fields, objects, or validation rules can break existing Flows.
Integration challenges: Flows often interact with other Salesforce features (Process Builder, Workflow Rules, Apex) and even third-party systems. Conflicts or issues in these integrations can cause Flow failures.
Human error: Screen Flows depend on users entering data correctly. Typos, incorrect formats, or missing information can all lead to problems.
Permissions and security: The user running the Flow needs the correct permissions to access and modify the data involved. Incorrect permissions are a common source of errors.
Governor Limits: Salesforce enforces limits on resources (queries, DML operations, CPU time, etc.) to ensure platform stability. Inefficient Flows can max out these limits and fail.
Flows often handle important business processes, like lead assignment, opportunity updates, and customer notifications. Errors in these key processes can lead to real problems, including:
- Detrimental impact on revenue
- Developer time spent troubleshooting and deploying fixes
- Negative customer experiences
These high stakes mean there’s added pressure on admins and developers to find solutions quickly to minimize business impact while managing the challenges involved with Salesforce Flows.
What are the common Salesforce Flow errors?
Nothing halts your automation process quite like a Flow error notification that you don’t understand. While the messages can sometimes seem obscure, understanding the common errors is key to quickly identifying and resolving the underlying issue. Without proper error handling, these faults can stop the Flow entirely. Let’s look at the most common errors you could hit with Flows:
Common permission issues and security errors
INSUFFICIENT_ACCESS_OR_READONLY
- The running user doesn’t have the necessary permissions (Create, Read, Edit, Delete) to perform the action the Flow is trying to do, or lacks access to specific objects or fields (Object/Field-Level Security). This is a fundamental block – if the user can’t access the field, the Flow stops.
Common data errors
REQUIRED_FIELD_MISSING or FIELD_CUSTOM_VALIDATION_EXCEPTION
- You tried to create or update a record without providing a value for a required field, or the data you provided violates a custom validation rule.
INVALID_FIELD or INVALID_FIELD_FOR_INSERT_UPDATE
- You’re trying to use a field that doesn’t exist, or you’re trying to set a value on a field in a way that’s not allowed (e.g., setting the ID field on a new record).
INVALID_TYPE or INVALID_CROSS_REFERENCE_KEY
- You’re trying to put the wrong type of data into a field (e.g., text into a number field), or you’re using an incorrect ID for a lookup field.
CANNOT_EXECUTE_FLOW_TRIGGER:
- A before-save or after-save record-triggered flow failed and prevented the record from being saved.
Variable configuration errors
The flow failed to access the value for [variable name] because it hasn’t been set or assigned.
- These errors typically occur when a Flow tries to use a variable that hasn’t been properly set up or assigned a value (it’s
null), often because a preceding step didn’t run as expected.
Parsing exceptions
INVALID_DATE_FORMAT or INVALID_NUMBER or System.JSONException: Unexpected character (’X’)
- Parsing errors occur when the Flow tries to interpret or convert data from one format to another (e.g., text to date/number, processing API responses), and the source data doesn’t match the expected format.
Limit-Related Errors
NUMBER_OF_SOQL_QUERIES or Too many SOQL queries: 101
- Your Flow has executed too many SOQL queries in a single transaction (the limit is 100).
Maximum trigger depth exceeded
- Your Flow is triggering other automation, which in turn triggers the original Flow, creating a loop.
Logic Errors
An unhandled fault has occurred in this flow
- This is a generic Flow fault error message that means something went wrong, but the Flow didn’t have a specific fault path to handle it. It often requires deeper debugging using logs to find the root cause, which could be any of the above types or a flaw in the Flow’s structural logic. (Catch-all for unhandled issues).
This list covers only some of the most frequently encountered Flow fault messages in Salesforce. By understanding these errors and their potential causes, you’ll be well-equipped to troubleshoot and fix your Flows more effectively.
Where to see Flow errors in Salesforce?
It can be frustrating working out where to find Flow error details in Salesforce, and once you find them, it can be confusing to unpick the data. There are a few different ways to check your Flow errors in Salesforce.
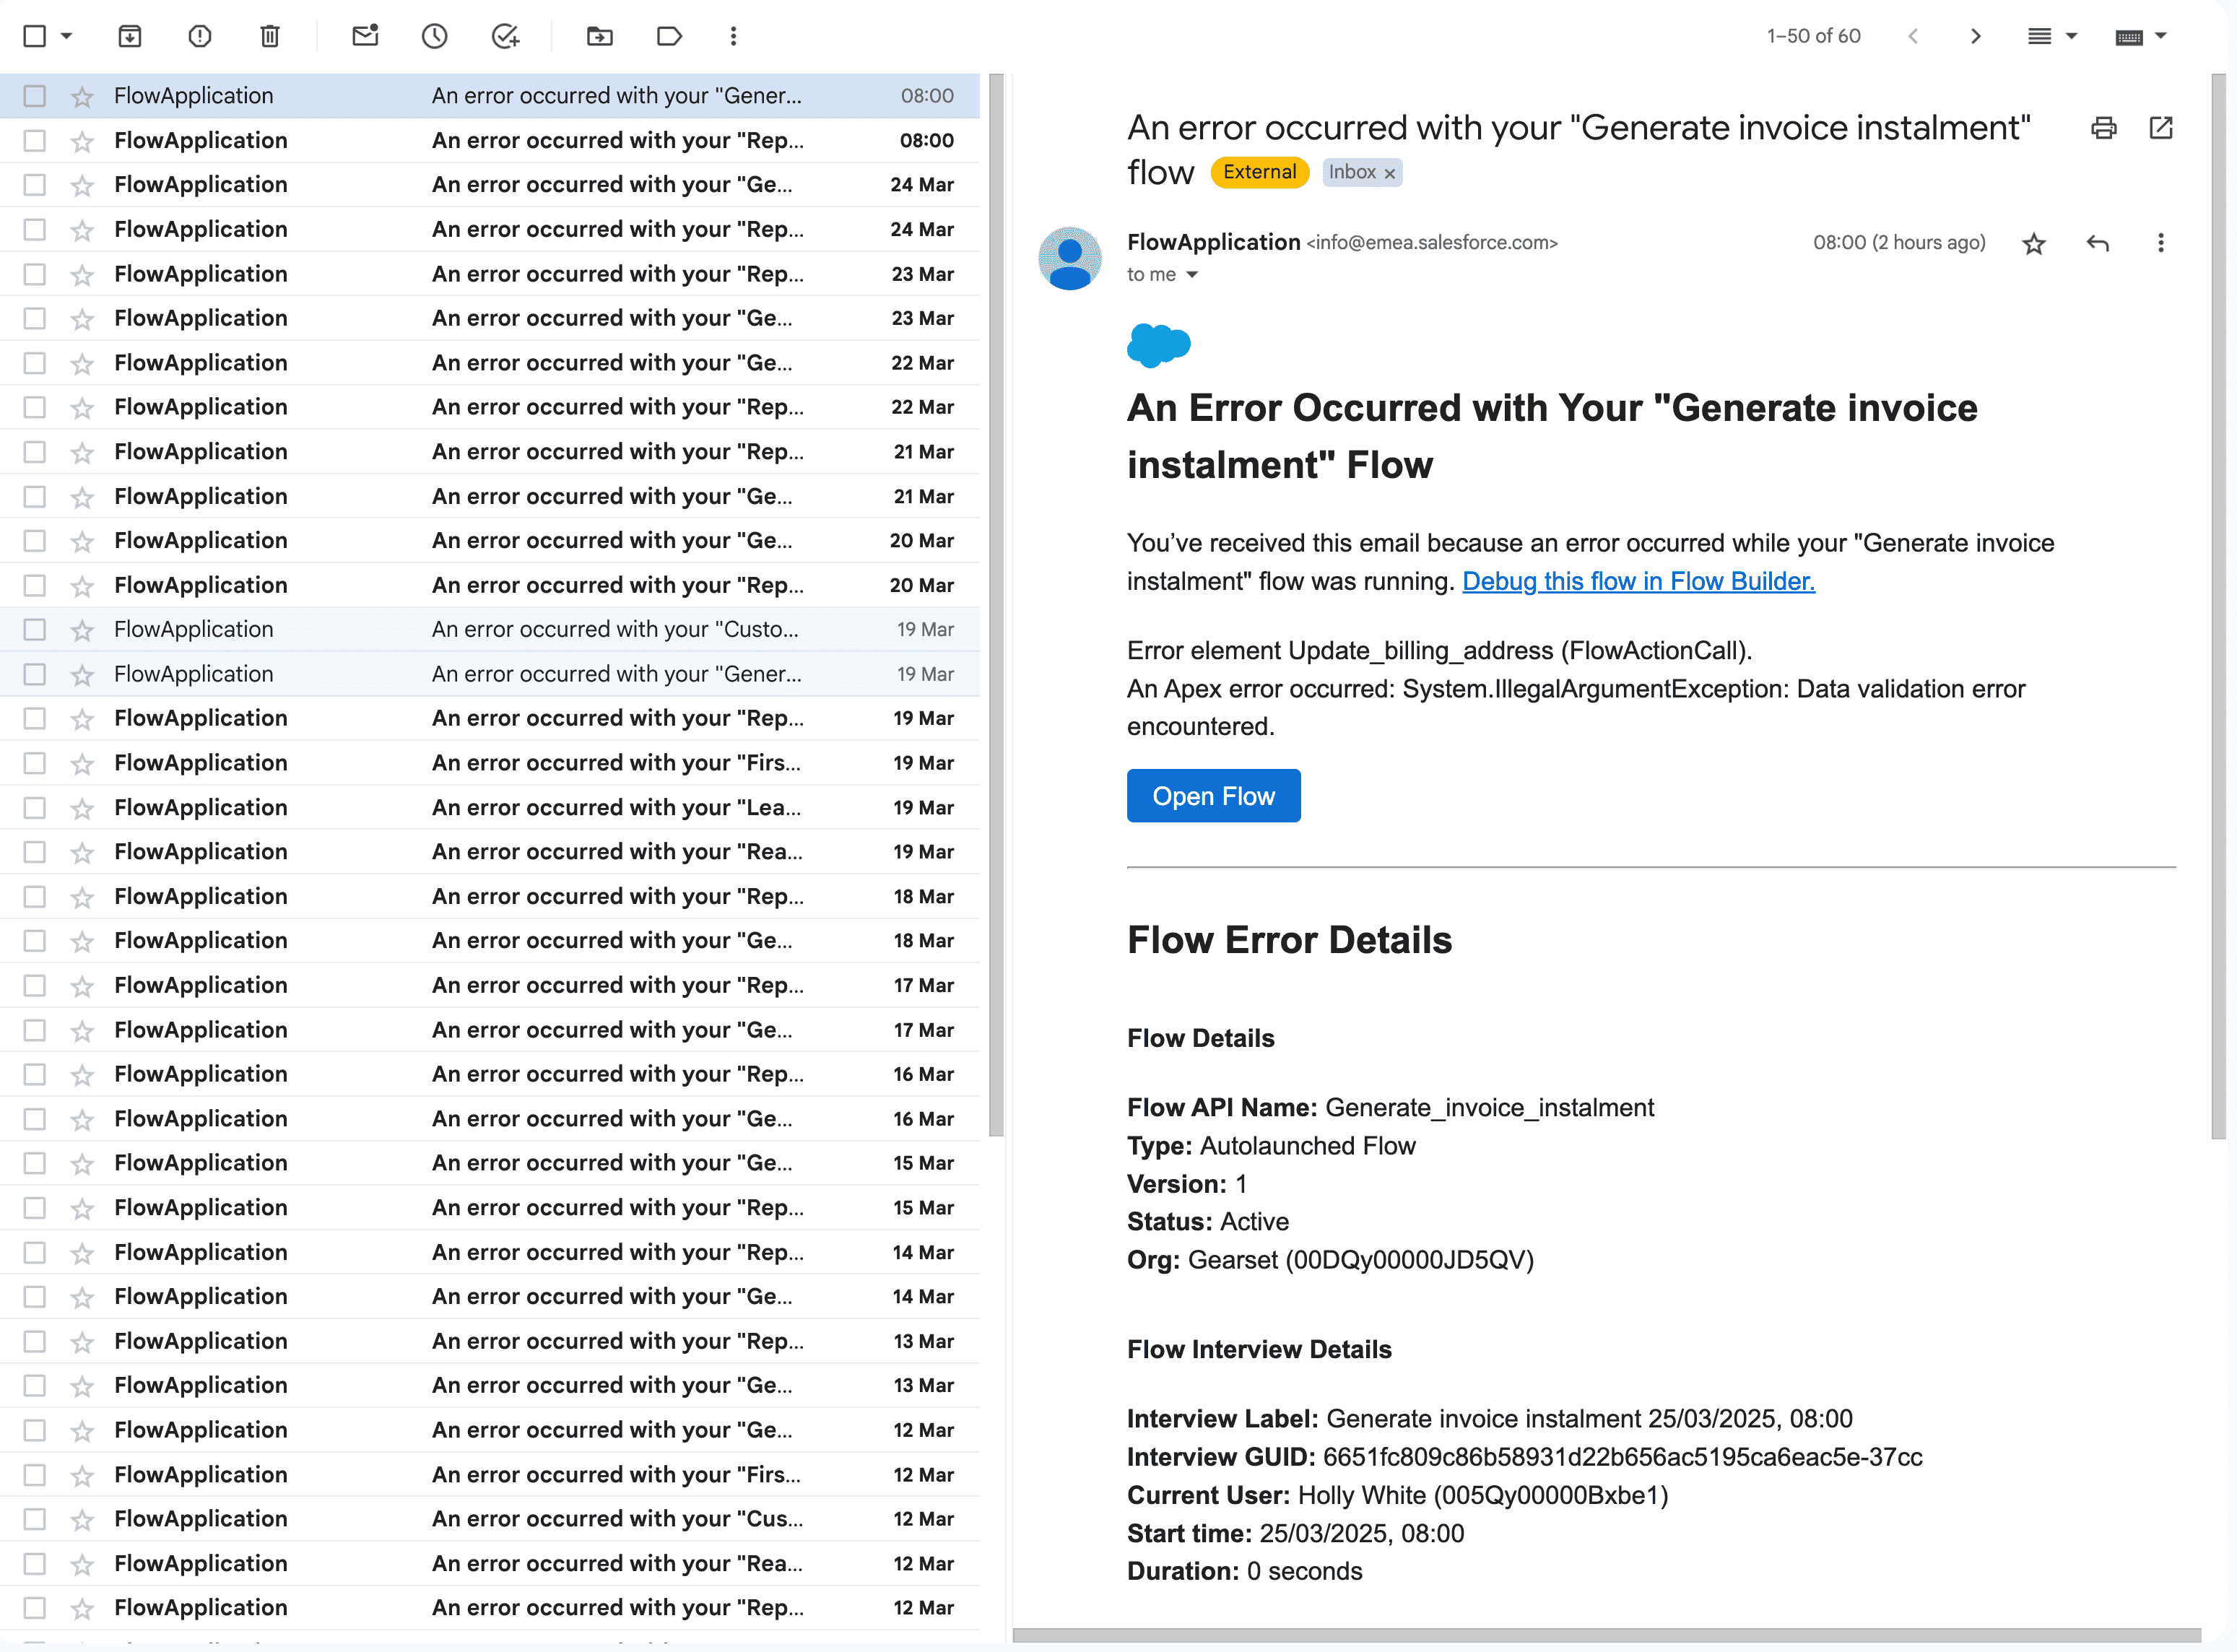
Flow error emails
By default, Salesforce sends an email to the last user who modified a Flow whenever it encounters an unhandled error. You can change who receives the emails in your Flow settings. The email will tell you the name of the Flow that failed, the detailed error message, including when the error occurred, and the Flow type. You can click the link and be taken into Flow Builder to fix the Flow manually.
You can also configure Apex exception email recipients in your org to receive Flow error emails, helping ensure that the right people are alerted even if the Flow builder is unavailable.
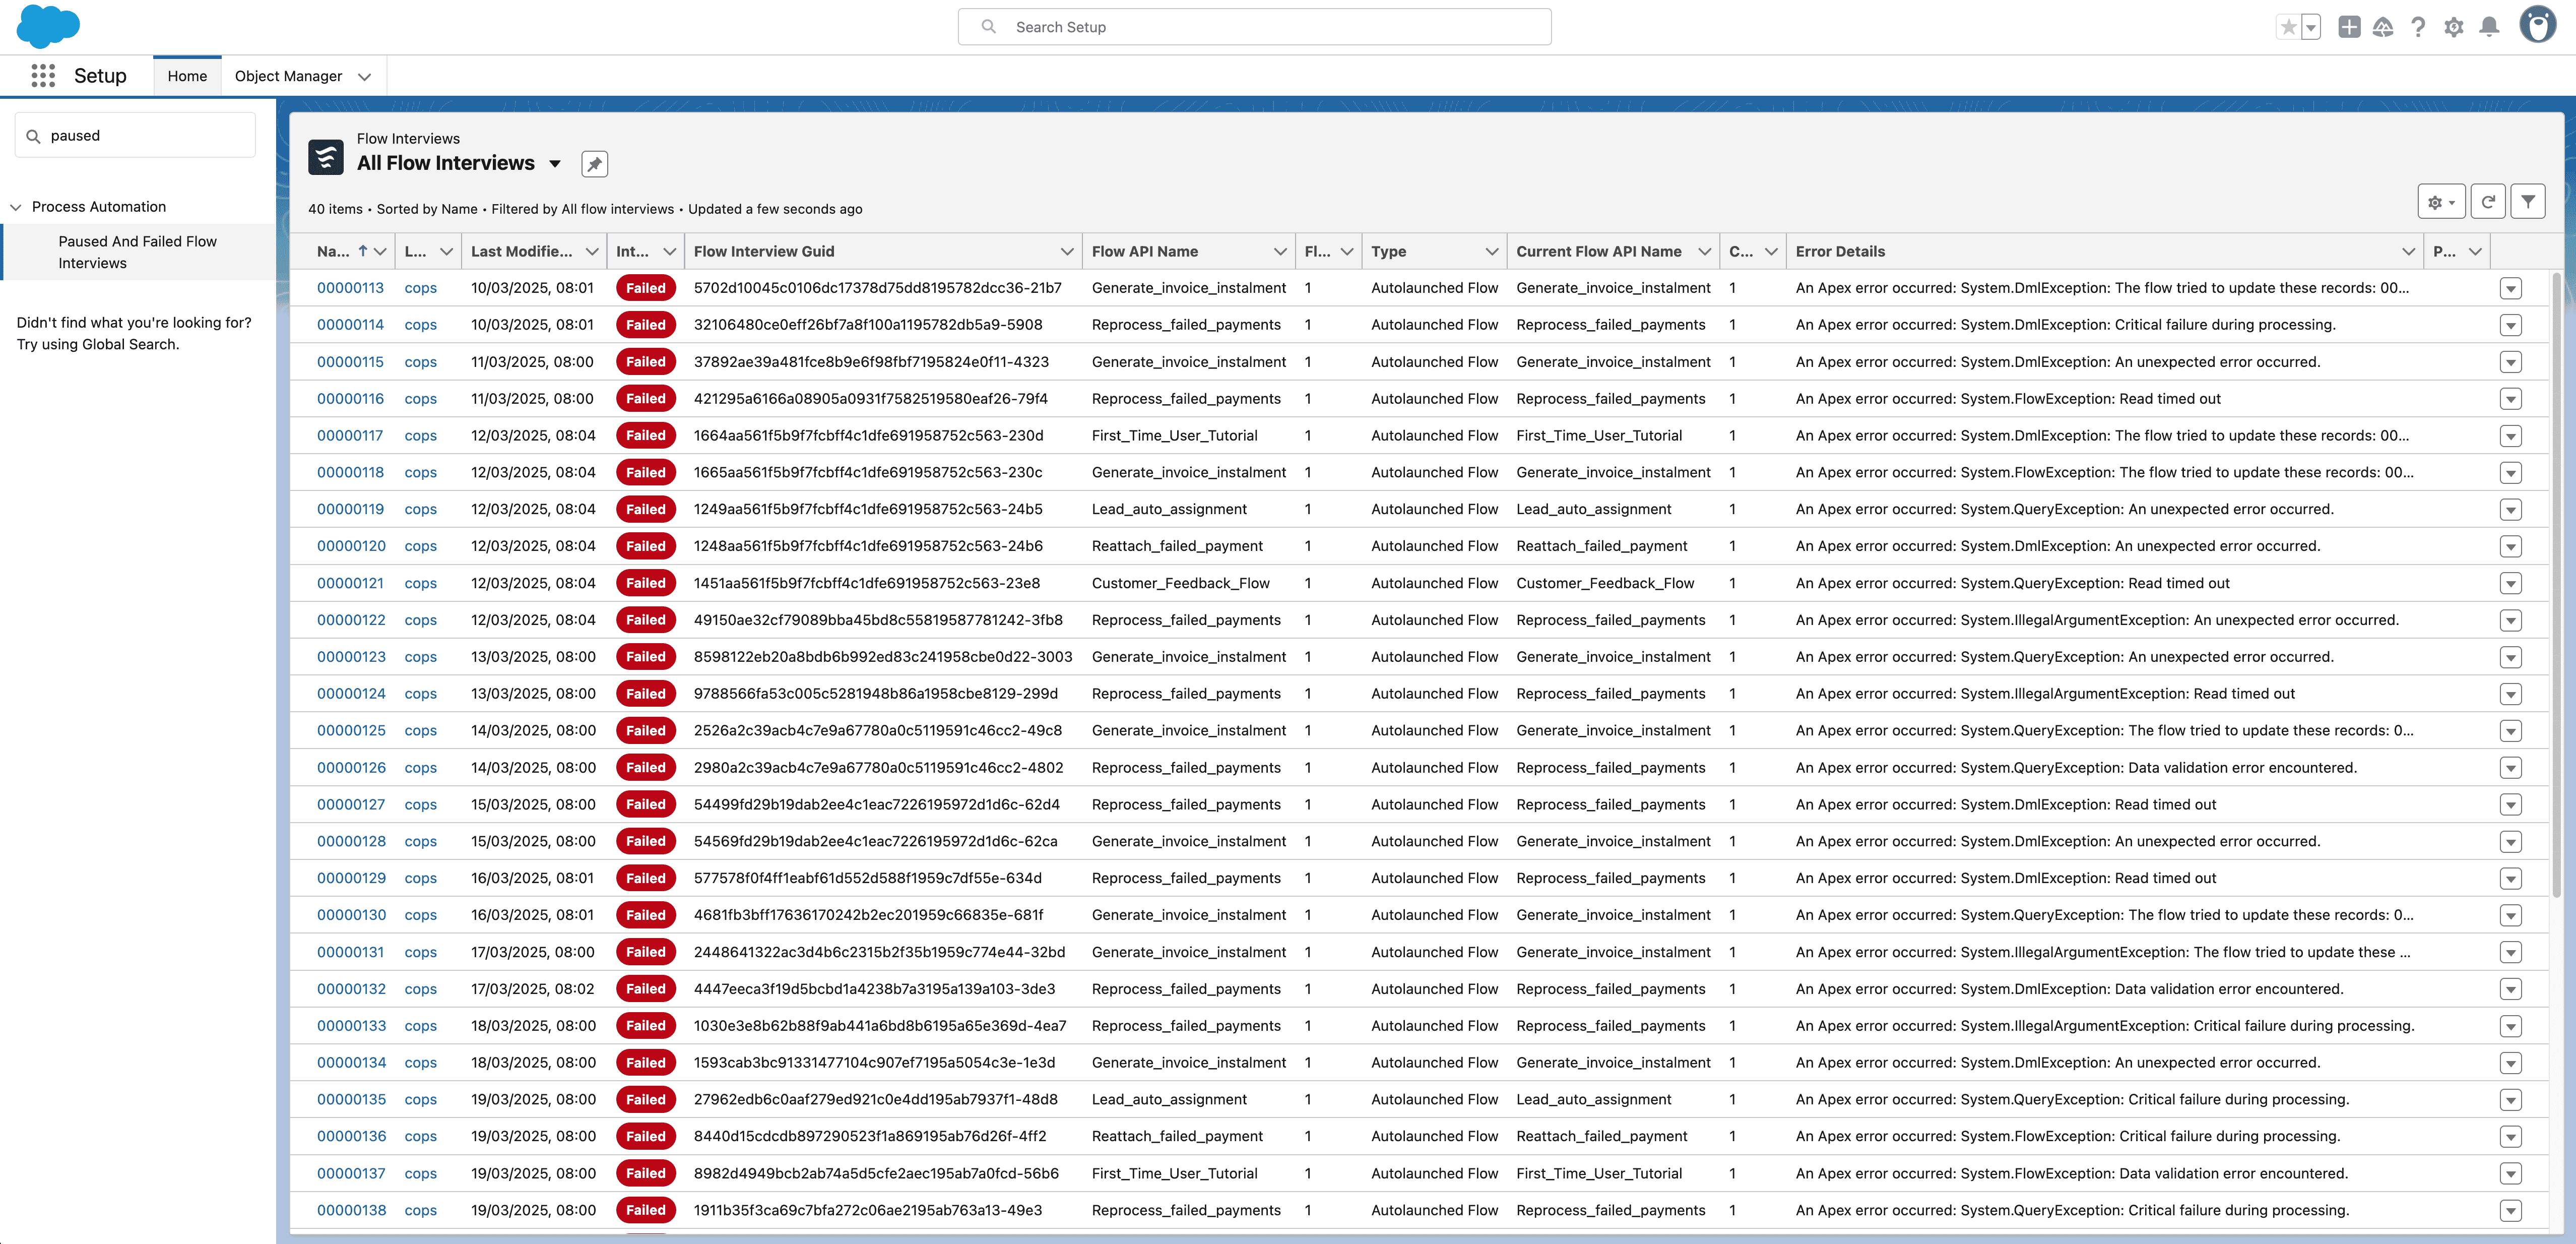
Paused and failed Flow interviews list view
In Salesforce you can click into a list from Setup that shows all Flow interviews that are either paused (waiting for user input in a Screen Flow) or have failed. From Setup, search for Paused and Failed Flow Interviews. You can see the name, the Flow status and if the Flow failed, you can click on the Interview Label to be taken through to Salesforce to manually debug the flow.
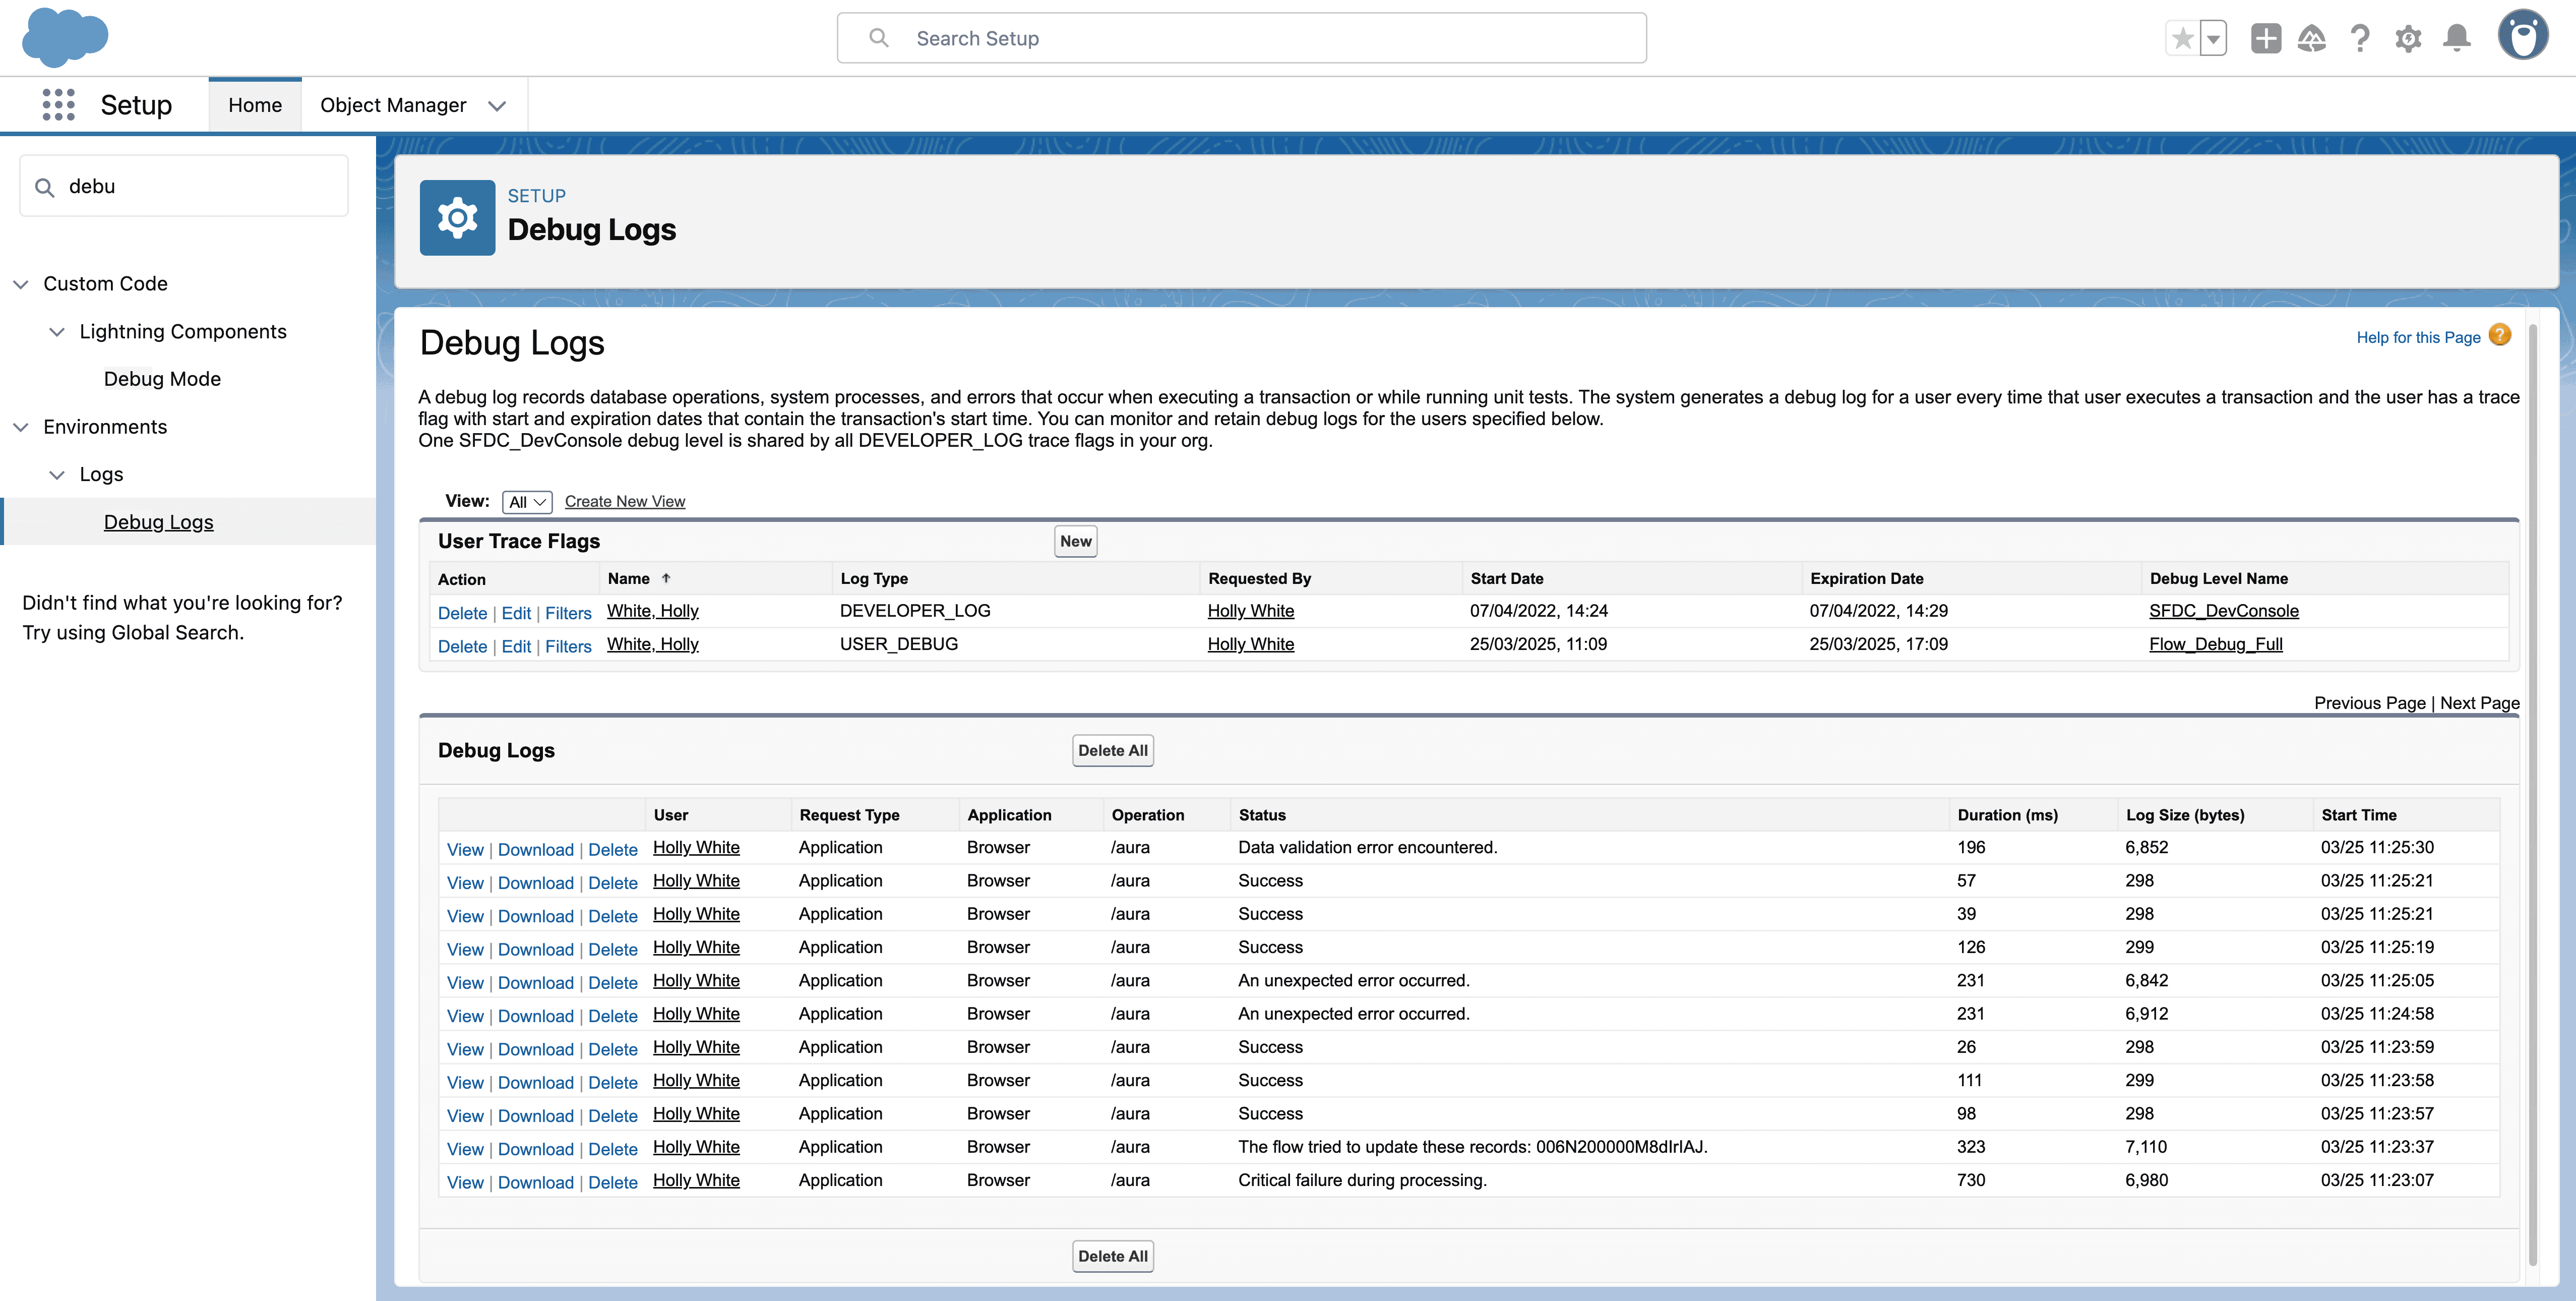
Debug logs
Debug logs are the most detailed record of what happened during a Flow’s execution, but they can be large and overwhelming. They show every step the Flow took, the values of variables at each point, and any errors encountered. You’ll need to set up a trace flag first, and then your Flow will start being flagged in the debug logs.
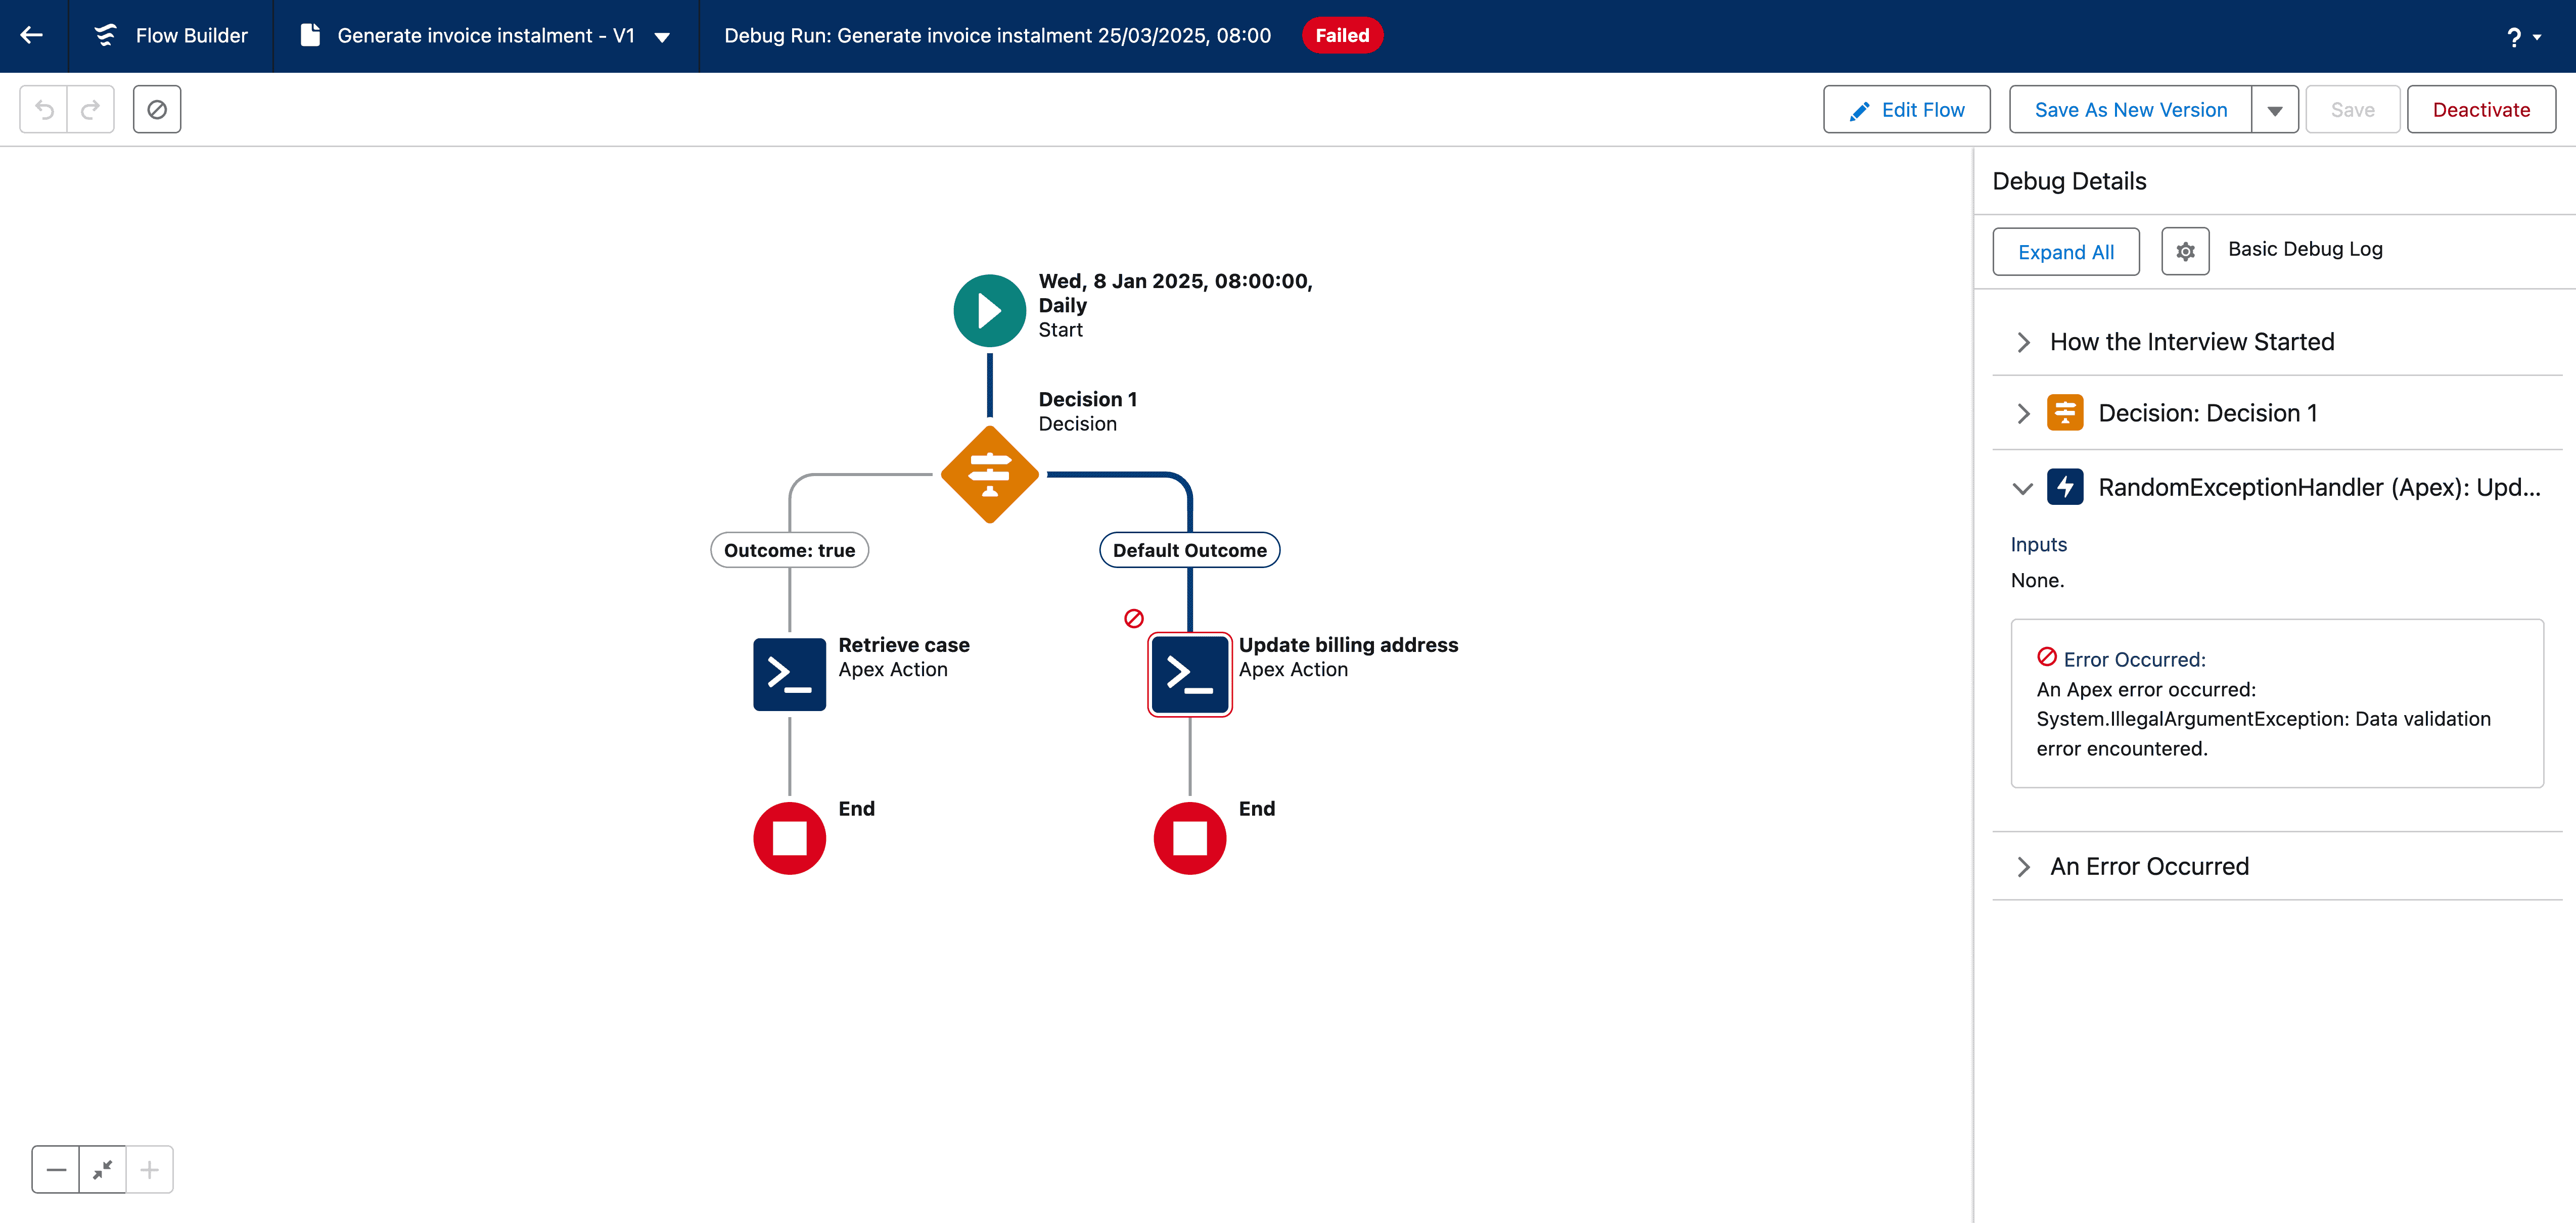
Manually debugging in Flow Builder
You can log into your org and test or debug your Flows manually. You can execute the Flow step-by-step in “rollback mode”. This means your changes made to the database in the debug run will be reverted so that you don’t accidentally change any real data.
Get full visibility of your Flow errors with Gearset: Flow error monitoring
Gearset’s Flow error monitoring focuses on giving you clear, real-time insight into Salesforce Flow errors, cutting through the noise and limitations of Salesforce’s standard email alerts. It’s built to help teams spot, understand, and fix Flow issues much faster. Start your free 30-day Gearset trial today and experience the benefits of Flow error monitoring firsthand.
What problems does Flow error monitoring solve?
Here are some of the key issues team run into when trying to solve Flow errors:
- Disrupting operations: Flow errors can easily disrupt important processes, potentially impacting revenue, frustrating users, and wasting valuable dev time if not fixed quickly.
- Email overload and notification noise: The built-in Flow error emails can often feel like a flood. These emails might not even reach the right person and make it tough to track trends.
- Complex debugging: Without clear context, developers and admins often spend lots of time hunting through logs or trying to reproduce errors just to figure out what went wrong.
- Lack of visibility and pattern spotting: Salesforce’s built-in tools make it hard to tell if an error is just a one-off glitch or part of a recurring pattern that needs a deeper fix.
Gearset’s Flow error monitoring helps teams overcome these issues and fix flows faster with real-time alerts, clear error insights, and powerful trend analysis. Let’s look at how you can quickly and easily set up Flow error monitoring for your org.
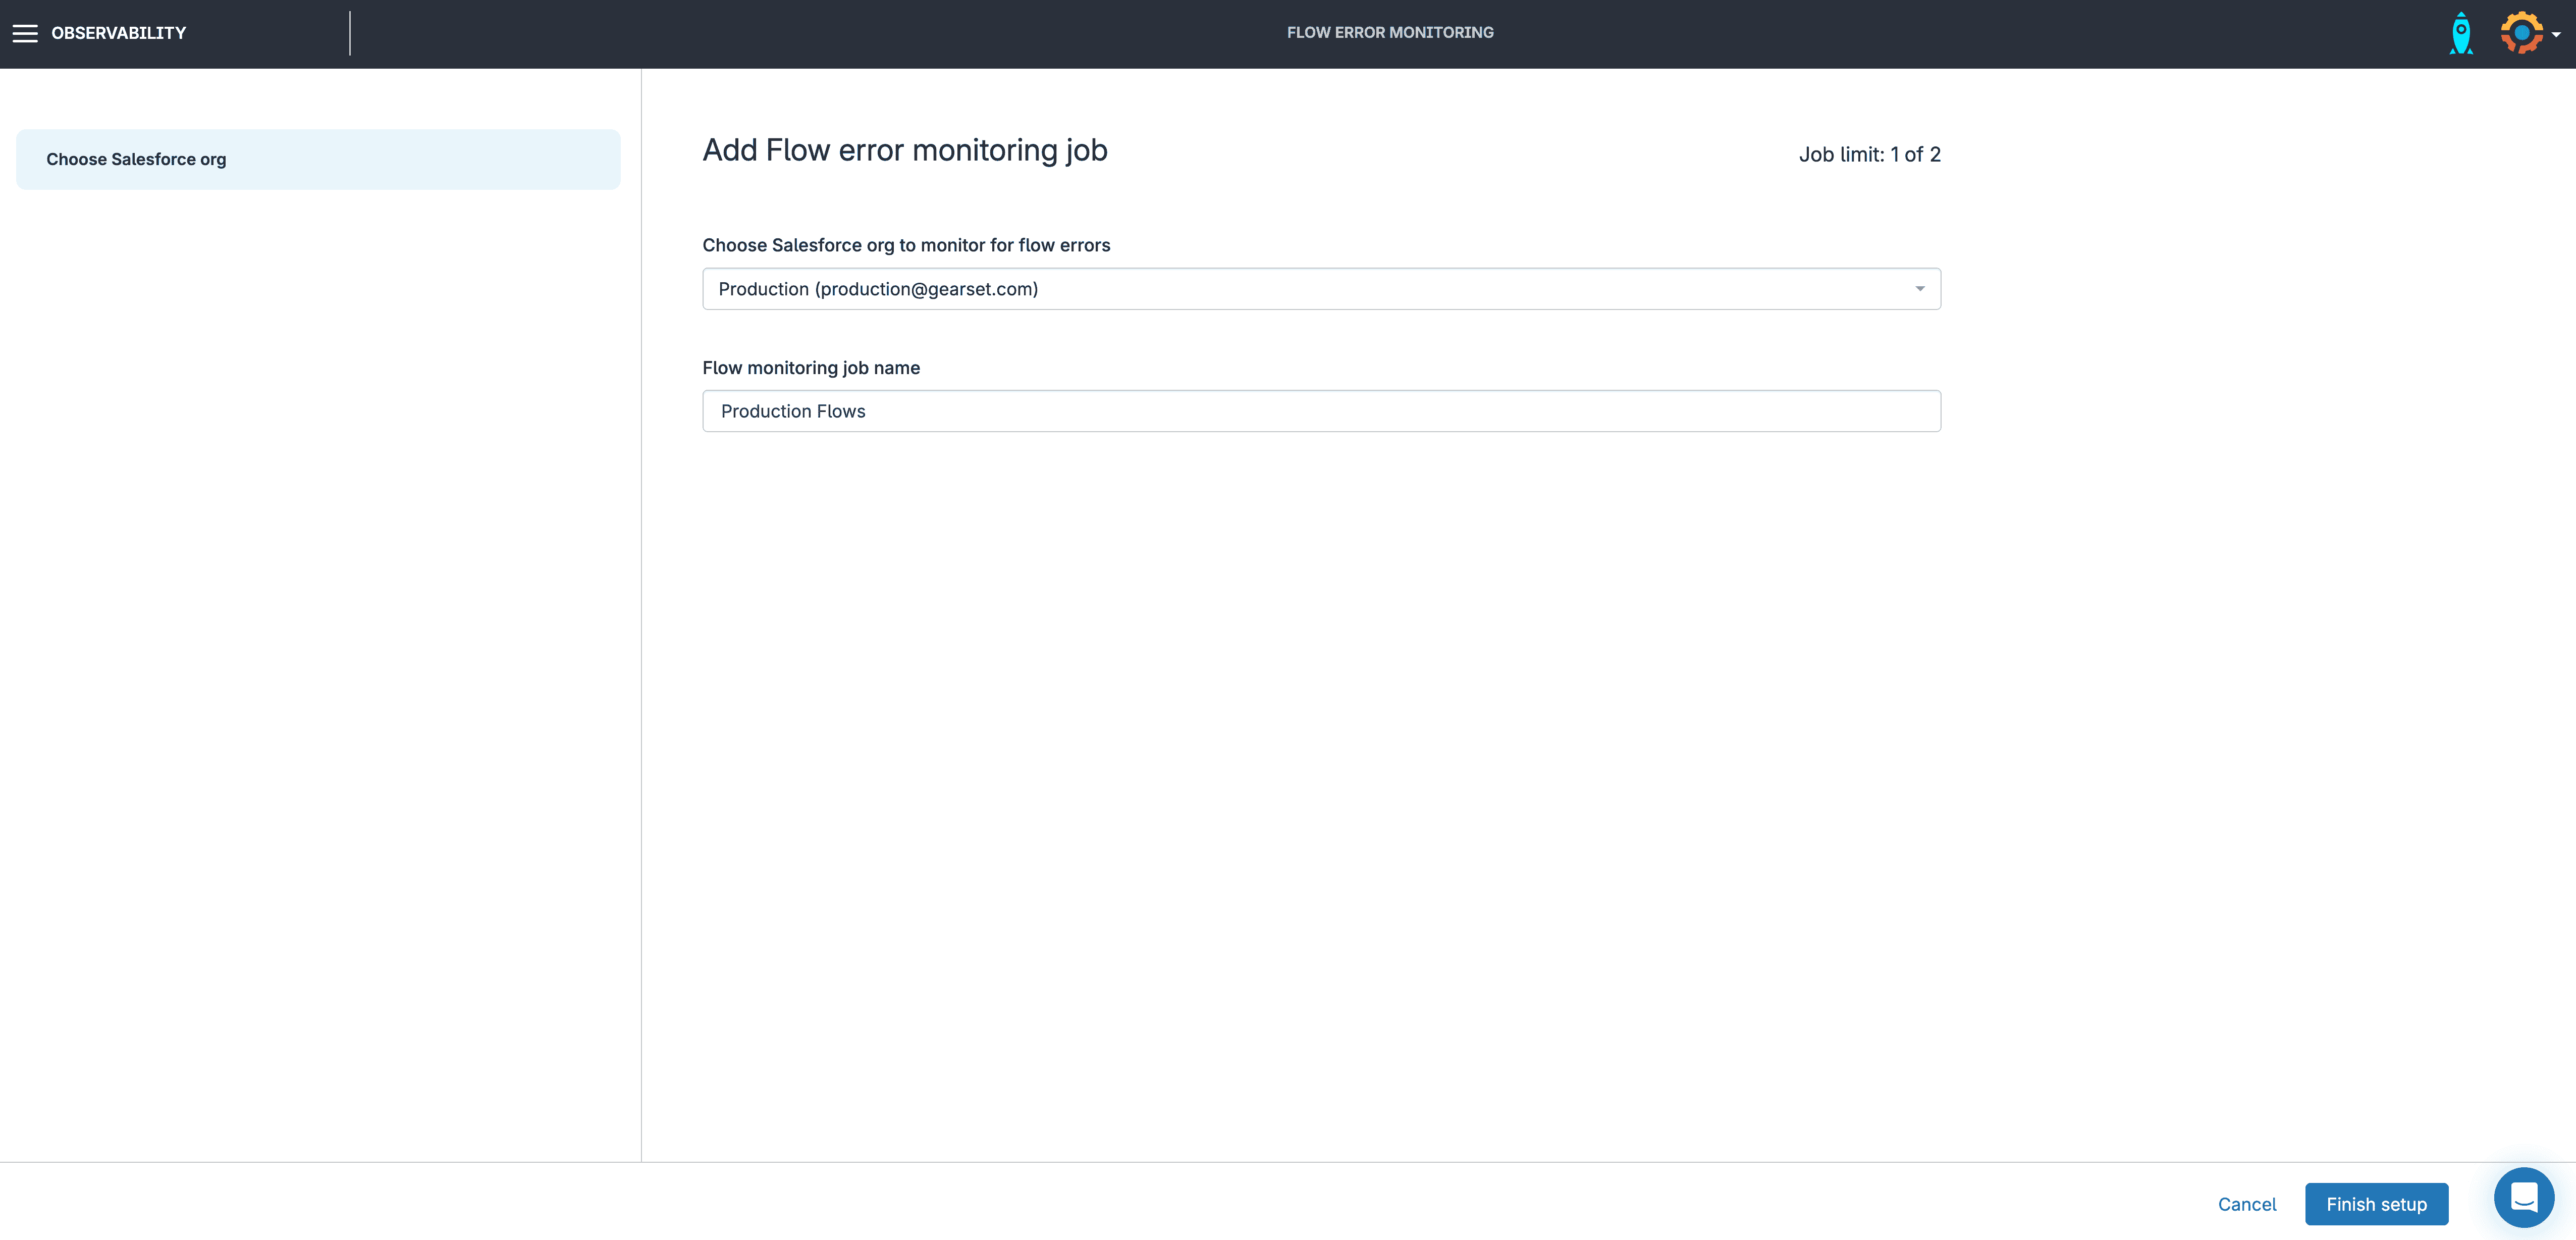
How to set up Gearset’s Flow error monitoring solution
Configuring a Flow error monitoring job in Gearset is handled via a simple 1-click setup. Choose the org you want to monitor, give the job a name and click Finish setup. Gearset will automatically configure the settings required in your org to complete the setup and start monitoring your org.
Flow error monitoring results
Gearset monitors the email inbox and displays Flow errors on a timeline for your chosen timescale. This enables easy identification of unusual patterns or sudden jumps in the number of Flow errors happening to aid investigations. Specific Flows can be selected for display on the timeline providing more granular analysis into error trends and behaviour for that Flow.
Gearset deployments are displayed on the timeline, highlighting if there’s a possible link to a recent deployment. Understanding whether there’s a relationship between recent changes and an increase in Flow errors helps you find the root cause and fix issues faster, leading to less disruption for your users and business processes.
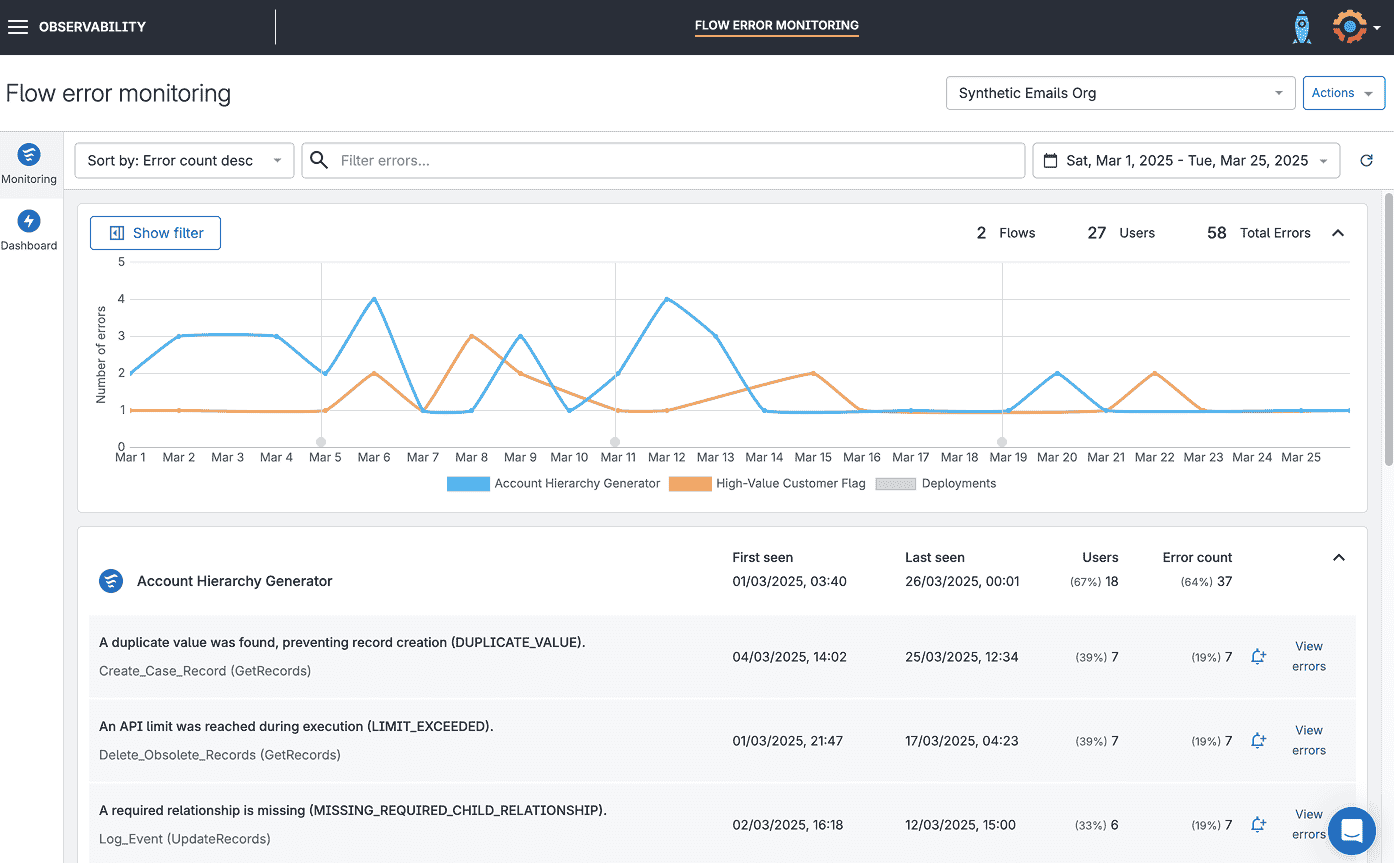
The timeline lets you click and drag to easily filter and investigate errors over specific time periods.
As Flow errors occur, Gearset groups Flow element and problem type information under the Flow on which they occur and aggregates key metrics like error count, number of users impacted by the error, and when alerts were first and last seen for each Flow.
Aggregating this data reduces noise that an email inbox would otherwise generate, and lets you quickly identify which Flows are causing the most errors, which elements are most frequently impacted, and most common error types affecting your Flows.
With these details, you get practical info to help spot where errors usually come from and figure out where your team should spend time fixing things.
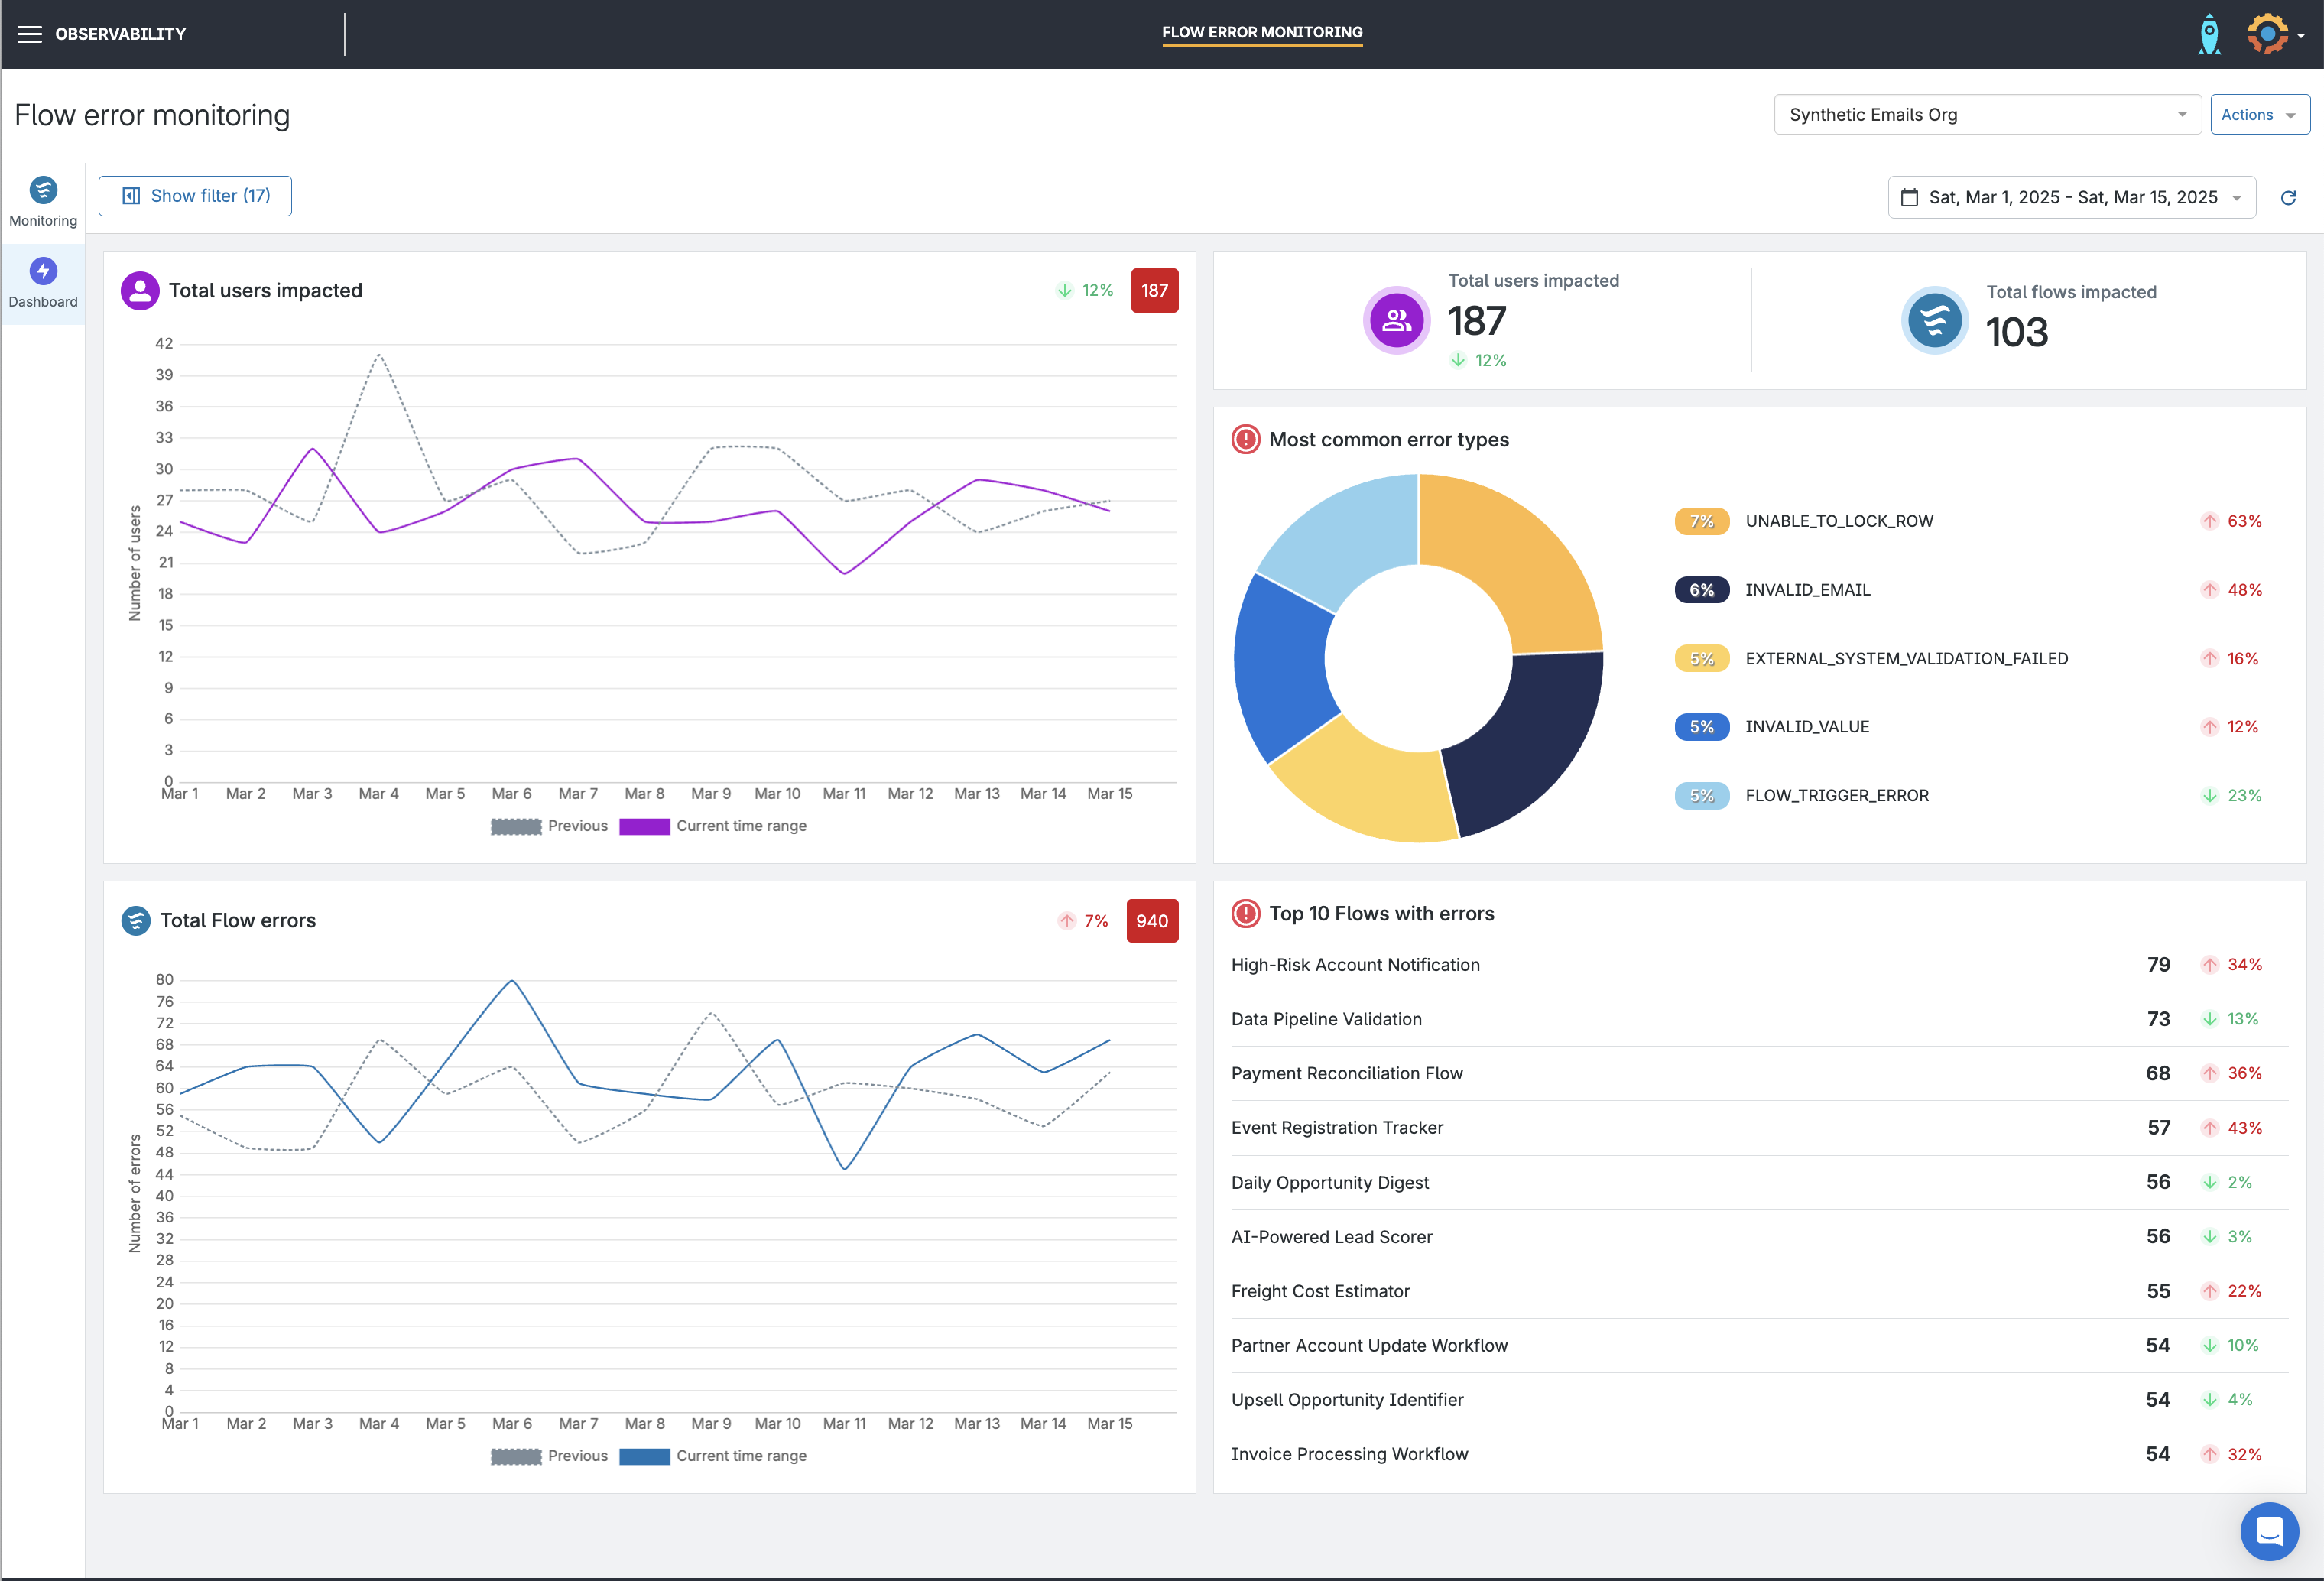
Flow error dashboard
Gearset’s Flow error dashboard provides a singular location for tracking changes to key metrics. For a selected time period error information is displayed for total Flow errors, users impacted, most common error types involved and Flows with most errors.
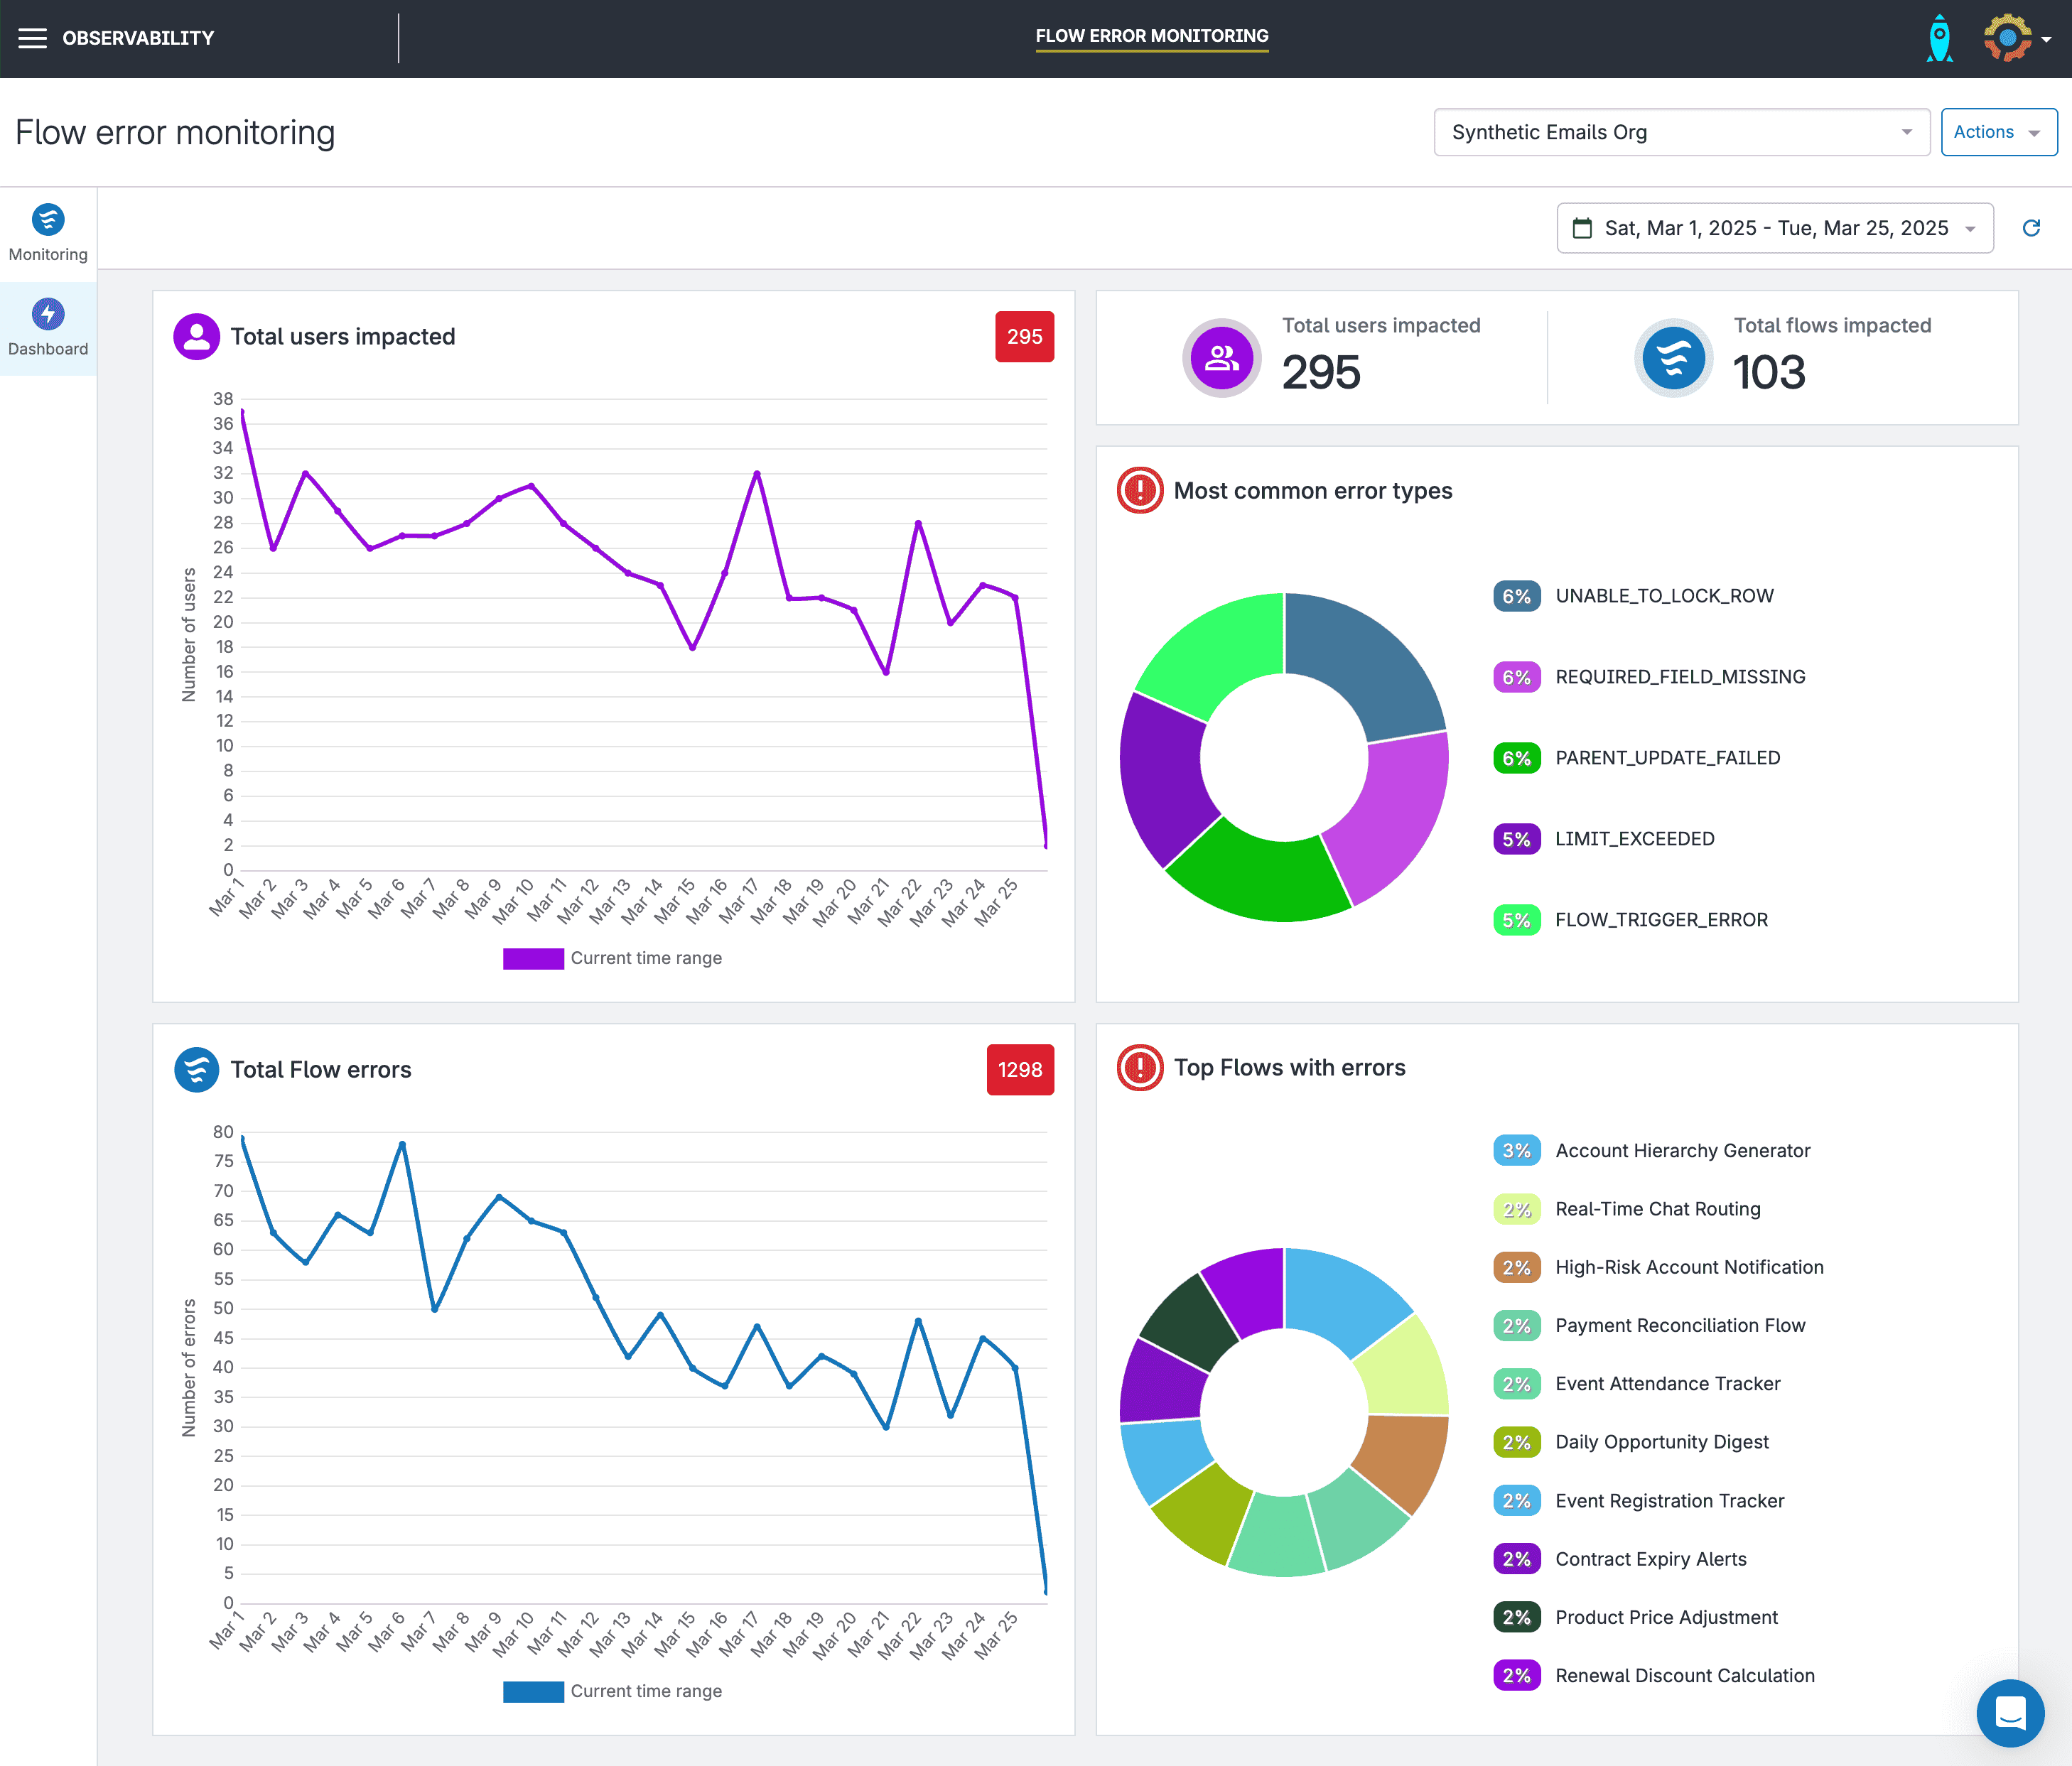
Gearset’s dashboard will automatically also show the error trends for the previous period too, making it easy to compare. For example, viewing the key metrics for this month will also display how that metric has changed when compared to the previous month. These analytics enable you to understand if remediation actions being taken are having the desired effect. It also enables you to identify if errors are trending upwards so you can enact changes faster to stop the increase.
Custom notifications and alerts
Under normal circumstances when a Flow hits an error, Salesforce will send an email(s) for every error to a single inbox. This leads to a few problems:
The inbox needs someone to be monitoring it, making it easy to miss important error reports when they arrive.
The emails can be really noisy, so it’s hard to know what’s actually important.
Often, this means you only find out about a problem when the issue is reported by users.
With Gearset’s Flow error monitoring, you can connect Slack and MS Teams to receive channel notifications, plus the ability to create custom notification rules, so your team only gets notified about the errors you actually want to know about.
You can set up rules based on volume of errors within a certain time period, or based on content contained within the email itself, such as Flow name, element, or error details.
For instance, you could set up a rule to send an alert if more than 100 errors happen in under a minute on a Flow named Update opportunity.
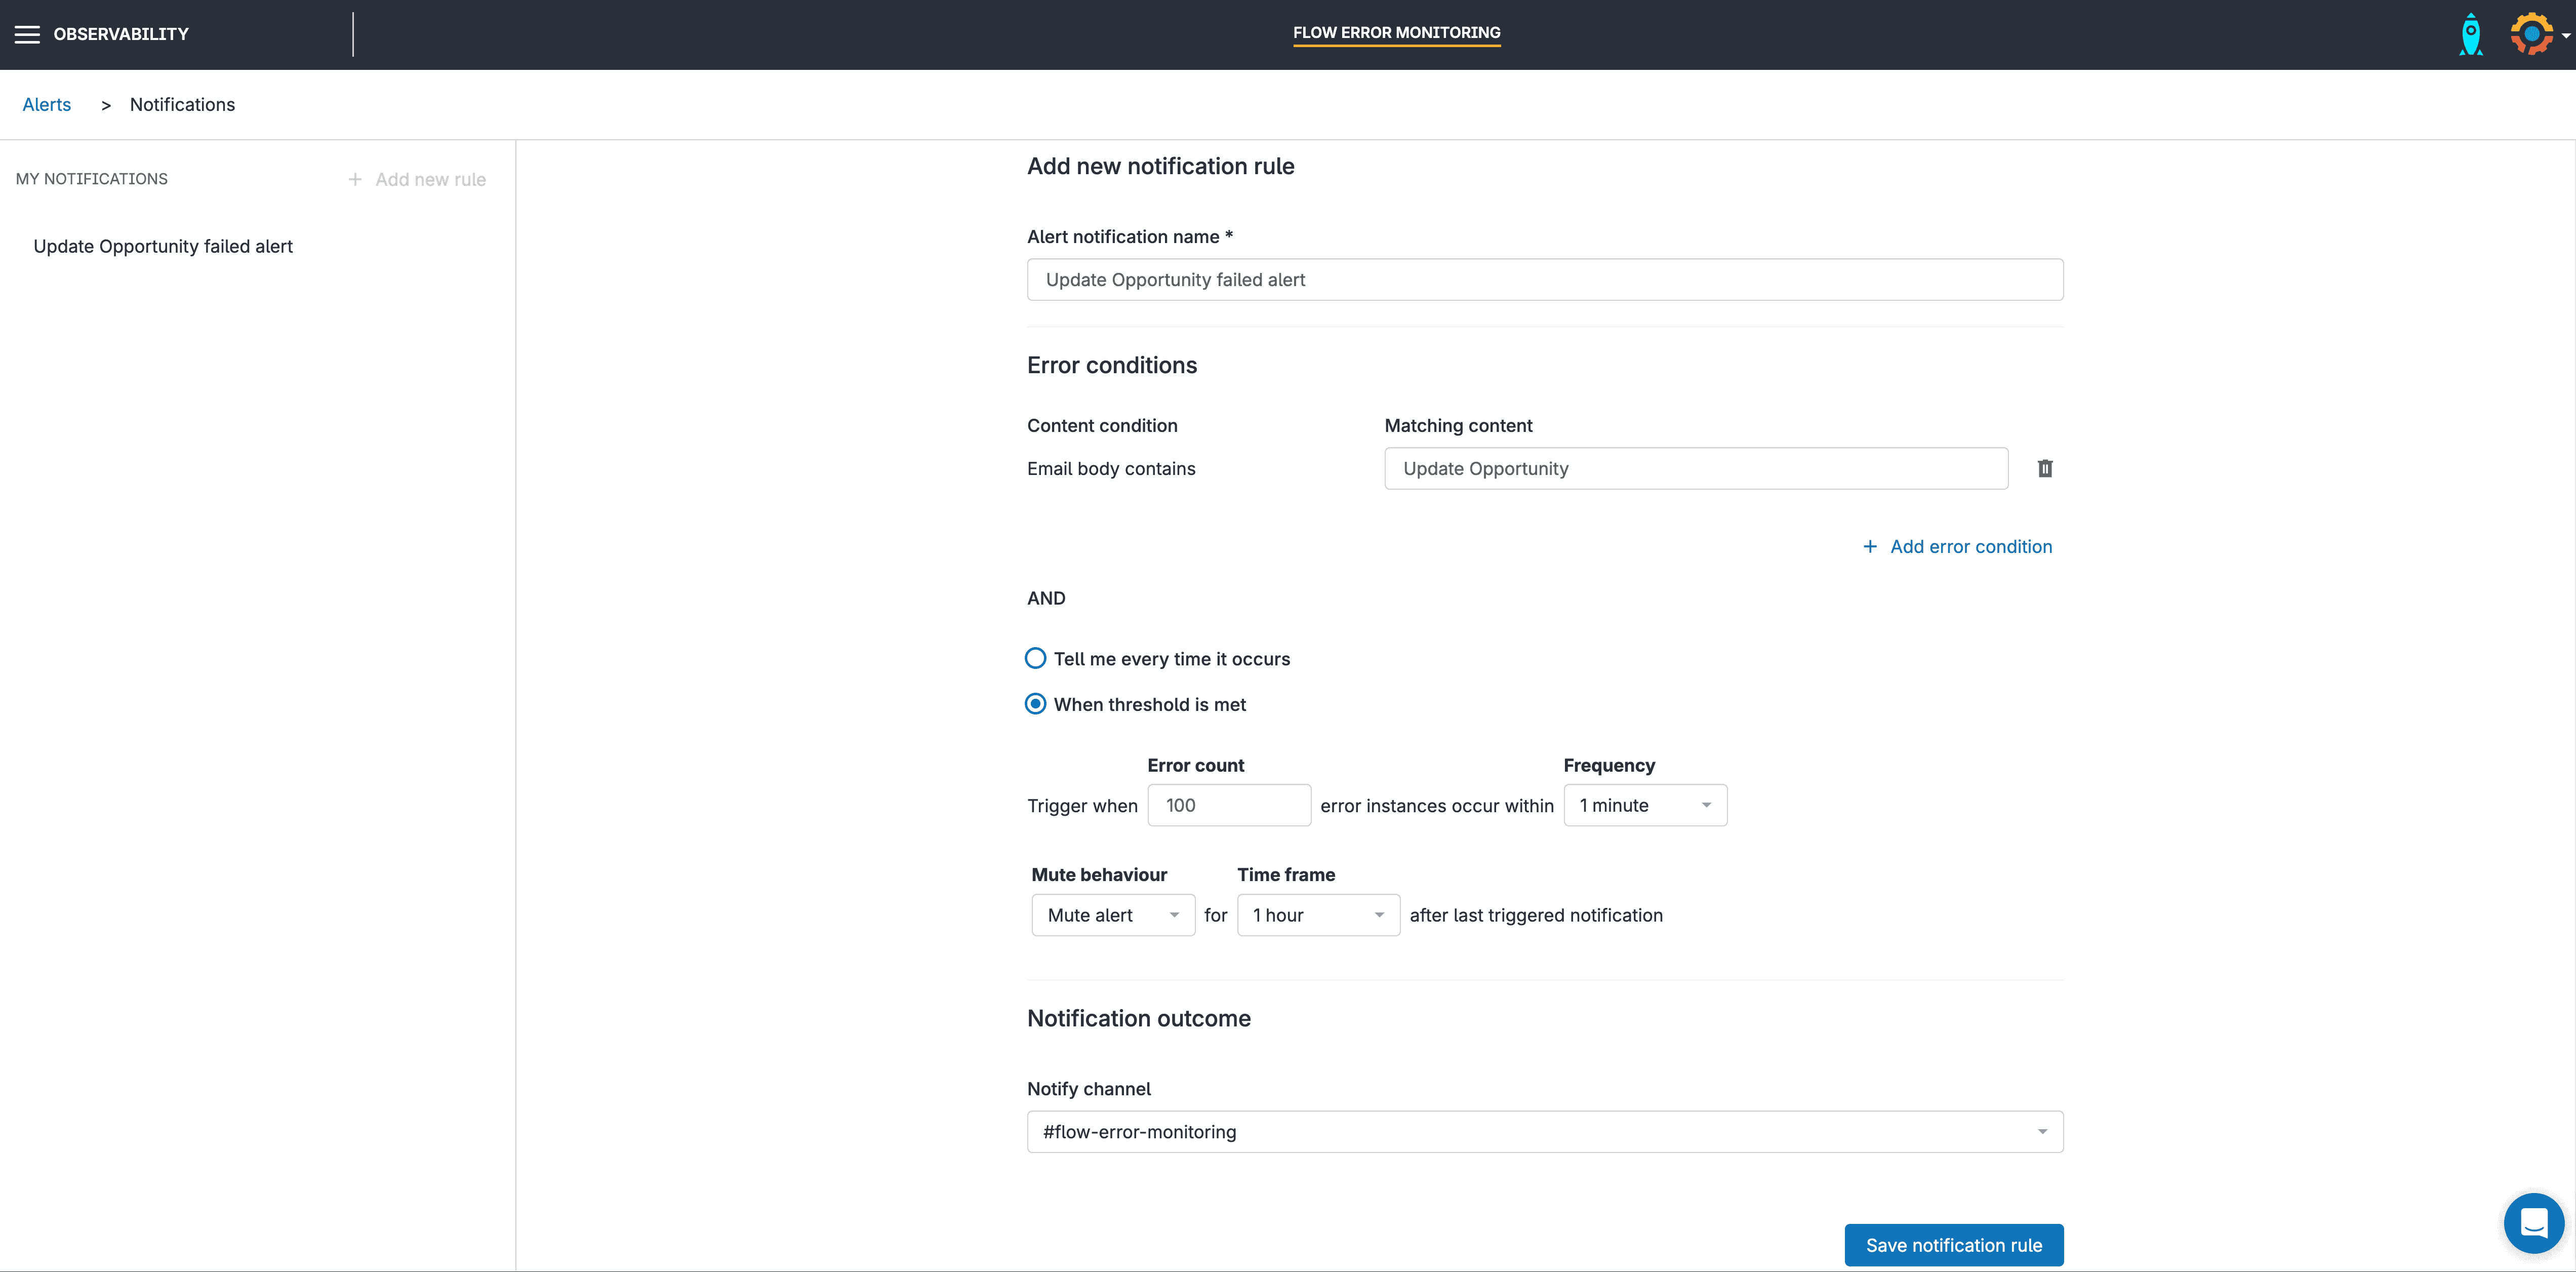
A message will be sent to your Slack or MS Teams channel to warn you that the conditions for a notification rule(s) you’ve configured has been triggered. This message contains the Flow name, problem type and Flow element involved.
The importance of observability in Salesforce DevOps
Effectively managing your Flow errors is a key part of observability — but it’s not the only thing to keep in mind. As your Salesforce DevOps processes mature and you’re pushing more changes to your end users faster, your orgs can quickly spiral into a mess of blind spots, bottlenecks, and missed issues — all hitting your users before you even know they exist. That’s where observability plays a huge role. Getting that deeper understanding means you can figure out why things go wrong, not just that they did. And when issues do pop up, you can make smart decisions on how to troubleshoot them.
By combining native tools with third-party solutions and proactive monitoring, teams can fix issues faster and get more out of Salesforce. Understanding the real-time health and performance of your Salesforce org, especially complex automations like Flows, is vital.
Here’s why observability is a core pillar of a complete Salesforce DevOps strategy:
Proactive issue detection and reduced deployment risk: By continuously monitoring metrics and trends, teams can spot potential issues before they impact users or destabilize production after a deployment. This significantly reduces change failure rates. Historical error trends can reveal recurring issues, enabling teams to implement fixes before they escalate.
Faster debugging and improved recovery times: When errors occur, automated alerts, detailed reports, and a unified view across system data drastically cut down debugging time when errors occur, directly improving Mean Time To Recover (MTTR). This shared visibility breaks down silos and enhances the cross-functional collaboration essential for a healthy DevOps culture.
Improved user experience and performance: Quickly resolving errors minimizes user disruption. Plus, understanding system performance helps optimize Flows and other components, contributing to a stable and reliable platform.
Informed decision-making and feedback loops: Data-driven insights into error patterns and system performance help prioritize backlog items within sprints and establish crucial feedback loops for continuous improvement of both the application and the development process itself.
Increased efficiency and DevOps workflow: Faster issue resolution, proactive prevention, and optimized resource usage reduce costly downtime and contribute to a smoother, more efficient DevOps workflow, enabling faster, more reliable releases.
For a closer look at how observability supports Salesforce teams, our observability whitepaper unpacks its role in helping Salesforce teams build healthier, more resilient orgs.
Take control of your Flow errors
Flow errors don’t just break automations — they block critical business processes, frustrate users, and drain dev time. Chasing down vague error emails and digging through debugging logs wastes hours of developing time. And when issues hit production, you’re often the last to know.
Gearset’s Flow error monitoring gives you the visibility and control you’ve been missing. Spot issues early, understand what’s gone wrong, and fix them fast — before your users even notice.
Start your free 30-day Gearset trial today and experience the benefits of Flow error monitoring firsthand.
