
Apex errors can be difficult to decipher, even for experienced developers — mainly because the error messages and related emails from Salesforce are so vague. To debug and resolve these issues effectively, it’s essential to understand their root causes. Following best practices in Apex code development can greatly reduce the likelihood of these errors occurring and with a good observability solution in place, teams can catch and fix issues faster and with more confidence.
This post explores strategies for handling Apex errors, improving the debugging process, and enhancing overall org performance through proactive Salesforce Apex error monitoring. We’ll walk through how Gearset’s error monitoring solution can help teams monitor, catch, and resolve errors before end users even know they exist.
What is Apex code?
Apex is Salesforce’s own programming language, designed for running flow and transaction control statements directly on the platform’s servers. It works hand in hand with the Salesforce API, giving developers the tools they need to shape how data and processes behave behind the scenes.
In practice, you’ll see Apex used to automate everyday business logic, build out custom features that go beyond what’s available out of the box, and generally push Salesforce further to meet specific business needs. It’s a powerful way to tailor the platform so it works exactly how your organization needs it to.
Different types of Apex and why they matter
There are several ways to execute Apex code, and each way behaves slightly differently:
- Triggers: run automatically when records are inserted, updated, or deleted
- Anonymous Apex: executed on the fly in the Developer Console, VS Code, Salesforce CLI, or third-party tools
- Scheduled Apex: runs at specific times you define
- Batch Apex: processes large numbers of records asynchronously
- Queueable Apex: similar to Future Apex, but more flexible and chainable
- Future Apex: runs in its own thread asynchronously when resources are free
Different types of Apex handle errors differently and may trigger different error emails. Understanding these differences helps you interpret errors faster.
TDX
What are Apex exceptions?
Apex exceptions are events that occur when something unexpected happens during the execution of your Apex code, disrupting the normal flow of a transaction. They act as signals that an operation couldn’t complete as intended — for example, when a governor limit is exceeded, a record you’re trying to access is null, or a DML operation fails.
It’s worth noting that some governor limits don’t actually throw a catchable exception. Instead, they stop the execution immediately. These limits can’t be wrapped in a try/catch, so it’s worth being aware of them when designing your code.
Salesforce provides a range of standard exceptions (such as NullPointerException or DmlException). Each exception type carries details — like an error message and stack trace — to help pinpoint the cause.
You can also define custom exceptions to suit specific use cases in your org. So instead of relying only on Salesforce’s standard exceptions, you can create your own exception types to represent specific error conditions in your org or business logic. This means the error is handled inside your code and no error email is sent.
Understanding how handled and unhandled Apex exceptions present and how they’re structured is the first step toward building more resilient Apex code and troubleshooting issues more efficiently.
Why Apex errors are a big pain point in Salesforce development
Apex is powerful, but when something goes wrong, it’s rarely obvious why. Errors can leave you in the dark, especially in larger or more complex Salesforce orgs. The biggest issue is that Salesforce doesn’t always give you clear, actionable feedback.
Here’s why teams struggle with Apex errors:
Vague error messages
Apex exception errors are often generic. Instead of telling you exactly what failed, they might simply say something like “Attempt to de‑reference a null object.” Without additional context, developers are left hunting through code and logs to find the real cause. Salesforce also surfaces error messages directly in the UI — but these can be just as vague, like “An unexpected error has occurred”.
Asynchronous complexity
Many Apex processes, such as future calls, batch jobs, or queued operations, run in the background. When errors happen there, they don’t always surface immediately in the UI. This makes them harder to trace and diagnose, especially if they occur outside of a user-triggered action.
Governor limits and hidden constraints
Salesforce enforces strict execution limits to keep multi‑tenant environments healthy. When you hit those limits (too many SOQL queries, DML statements, or heap size), the resulting errors can be abrupt and disruptive — often appearing only after significant processing has already happened.
Impact on users and releases
Unresolved Apex errors can lead to broken automation and frustrating user experiences. While they don’t usually block a deployment outright, they can lurk unnoticed if your tests don’t catch them. That means a deployment might succeed, but the code could still fail when it runs in production. Without robust error handling and monitoring, teams can spend hours digging through debug logs or reproducing scenarios, slowing down delivery and response times.
Apex errors are a big pain point for teams because they’re often hard to see, harder to understand, and time‑consuming to fix — unless you put the right monitoring, coding practices, and troubleshooting strategies in place.
How to check Apex errors natively in Salesforce
To tackle these challenges, Salesforce provides several native tools that help you spot and investigate Apex errors.
Apex exception email notifications
Salesforce automatically sends emails to admins when an unhandled exception occurs in a synchronous transaction, including the exception type, message, and stack trace. These emails are limited in detail and frequency but are an important first alert.
Via the Tooling API
You can query objects like ApexExceptionEvent through the Tooling API to pull error data programmatically. This lets you feed error details into custom dashboards or external monitoring tools.
Salesforce UI error messages
Users may see generic messages like “An unexpected error has occurred,” which offer little context. Correlating these with debug logs or exception emails is key to identifying the root cause.
Apex debug logs
Debug logs capture detailed execution traces, governor limit usage, and stack traces. Filtering these logs helps you pinpoint the exact point of failure in your code.
Platform events
You can publish error details as platform events for real‑time monitoring. External systems or alerting frameworks can then subscribe to these events to catch issues quickly.
Common Apex errors
Once you know where to look, it helps to understand the types of errors you’re likely to see and how they typically arise. Most Apex errors are runtime exceptions — issues that occur when your code executes. These include common problems like null pointer errors, out-of-bounds list access, unhandled query issues, DML failures, and governor limit violations:
- NullPointerException: Happens when attempting to access a null object or uninitialized variable. Always check that an object or variable isn’t null before you use it.
- ListIndexOutOfBoundsException: Occurs when trying to access an index outside the bounds of a list. Always validate list sizes before referencing indices.
- QueryException: Thrown when a SOQL query doesn’t return the expected data or references invalid fields. Review your query conditions and field access.
- DmlException: Raised when a DML operation fails, such as inserting a record that violates validation rules or required fields. Handle these in try‑catch blocks and validate data before performing DML.
- TypeException: Happens when assigning or casting incompatible data types. Review variable declarations and type conversions carefully.
- NoAccessException: Raised when a user attempts to access an object or field they don’t have permission for, even if their profile seems permissive — check FLS and sharing rules. This only occurs when your Apex code explicitly enforces field or object‑level security.
Some of these runtime exceptions can be caught early with static code analysis or flagged during peer reviews, reducing the chance they make it into production.
Governor limit exceptions
Salesforce enforces strict governor limits to protect overall platform performance. When these limits are exceeded, some will throw a catchable runtime exception, while others won’t — they simply halt execution.
- TooManySOQLQueries: Triggered when a transaction runs more SOQL queries than the limit allows. Optimize your code by batching queries and avoiding queries inside loops.
- TooManyDMLStatements: Occurs when you perform too many DML operations in a single transaction. Combine operations where possible and ensure you’re not running unnecessary DML inside loops.
- Heap Size Limit Exceeded: Raised when your code uses more memory than allowed during a transaction. Limit large collections, process data in smaller batches, and release unused references where possible. This exception is uncatchable.
Trigger-related errors
Triggers can introduce complex behavior when they fire automatically in response to data changes, and without safeguards they can easily cause unexpected failures.
- Recursive Trigger Execution: Occurs when triggers call each other repeatedly without checks, causing infinite loops. Use static variables or custom logic to prevent recursion.
- Mixed DML Operation: Happens when trying to perform DML on setup and non-setup objects in the same transaction (e.g., updating a user and account together). Use
@futuremethods or separate transactions to resolve.
Callout and asynchronous errors
Errors in asynchronous processes or external callouts can be harder to catch because they don’t always surface immediately in the UI or logs.
- CalloutException: Triggered when a callout fails due to timeout, improper request format, or synchronous callout in a non-callout context (like a trigger). Ensure you’re using
@future(callout=true)or Queueable interfaces correctly. - Asynchronous Errors: Can be trickier to debug since they don’t always surface immediately. Monitor logs and set up alerting for unhandled async failures using Platform Events or exception email notifications.
Error handling and prevention in Apex
A robust error‑handling strategy isn’t just about catching problems when they happen — it’s about designing your code, monitoring, and following best practices to prevent errors in the first place.
Handle errors gracefully
Use try-catch blocks to manage exceptions gracefully. In Lightning components (Aura and LWC), throw and catch AuraHandledException to return meaningful messages to the UI. Custom error messages that include class names and line numbers make it easier to trace and fix issues.
Apex exception emails are only sent for unhandled exceptions in asynchronous transactions. For example, they’re sent for the first unhandled exception in a Batch, but Salesforce limits them to one email per hour per unique exception and caps them at around 50,000 emails per day. In some async operations, Salesforce may also pause email delivery to avoid rapid‑fire notifications. These emails contain less detail than Flow error emails, but they’re a crucial signal that something has gone wrong behind the scenes.
Apex code optimization to avoid errors
Optimizing your Apex code is a preventative strategy that helps reduce errors and improve overall performance. Batching your operations to handle large datasets efficiently, and reduce SOQL queries by avoiding queries inside loops. Validate data thoroughly to prevent DmlException errors, and simplify your logic for better readability and maintainability. You can also use wrapper classes to standardize how error data is returned, making it easier for teams to collaborate on handling and resolving issues.
Monitor your org for issues
Beyond fixing issues as they arise, monitoring your org for early signs of errors can save time and prevent user disruption. Tools like Gearset provide observability for Apex and Flow errors. With customizable alerts based on error content or volume, your team can react quickly and collaboratively.
While monitoring is available for up to two orgs by default, scaling this coverage requires contacting support — well worth it for growing teams.
Implement structured logging and analysis
Effective error analysis starts with good logging. Use Platform Events for real‑time error tracking and alerting, and build or adopt exception logging frameworks to capture detailed information. Review logs regularly to spot trends and prevent recurring issues. Salesforce can also send Apex exception email notifications for unhandled errors — particularly in asynchronous processing — so make sure email deliverability is configured and the right people are receiving these alerts.
Review code to maintain quality
Regular code reviews help teams catch problems before they reach production. Review SOQL and DML usage, check error‑handling patterns, and assess overall logic to ensure the code is efficient and resilient. Static analysis tools can automate parts of the process, while peer reviews keep quality high and reduce debugging time.
The importance of observability in Salesforce DevOps
Effectively managing Apex errors is a critical part of observability — but it’s only one piece of the puzzle. As your Salesforce DevOps processes scale and you deliver changes more rapidly, your orgs can quickly become riddled with blind spots, undetected issues, and tricky bottlenecks — all of which might impact users before you even know there’s a problem.
That’s where observability becomes essential. It gives you a deeper understanding of your Apex code’s behavior, so you can uncover the why behind failures — not just that they happened — and make smarter decisions when it’s time to troubleshoot.
Why observability matters
Observability helps teams spot issues before they impact users, block deployments, or force a costly release rollback. By monitoring Apex exceptions, runtime patterns, and deployment outcomes, you gain visibility into test coverage, governor limits, and exception trends, reducing failures, and preventing recurring problems.
When errors do happen, observability tools like debug logs, exception reporting, and integrated alerts make it faster to identify and fix the root cause. Shared visibility across development, QA, and release teams improves collaboration and accelerates recovery times.
Resolving errors quickly also protects the user experience, especially in customer‑facing processes or high‑volume data jobs. Observability helps you see performance bottlenecks in triggers, asynchronous jobs, and callouts, helping you keep your org fast and reliable.
Error trends and telemetry inform smarter decisions during sprint planning and retrospectives. By targeting problem areas and refining practices, teams drive continuous improvement while working more efficiently and releasing with greater confidence.
For a deeper dive into how observability supports Salesforce DevOps, our observability whitepaper unpacks its role in helping teams build scalable, maintainable orgs that stay healthy over time.
Gearset’s error monitoring solution
Gearset’s error monitoring solution keeps teams in control of Flow and Apex errors in their Salesforce orgs by delivering alerts and detailed insights into error patterns. With automatic aggregation and instant notifications, you can rapidly identify, diagnose, and resolve issues, keeping your business processes running smoothly.
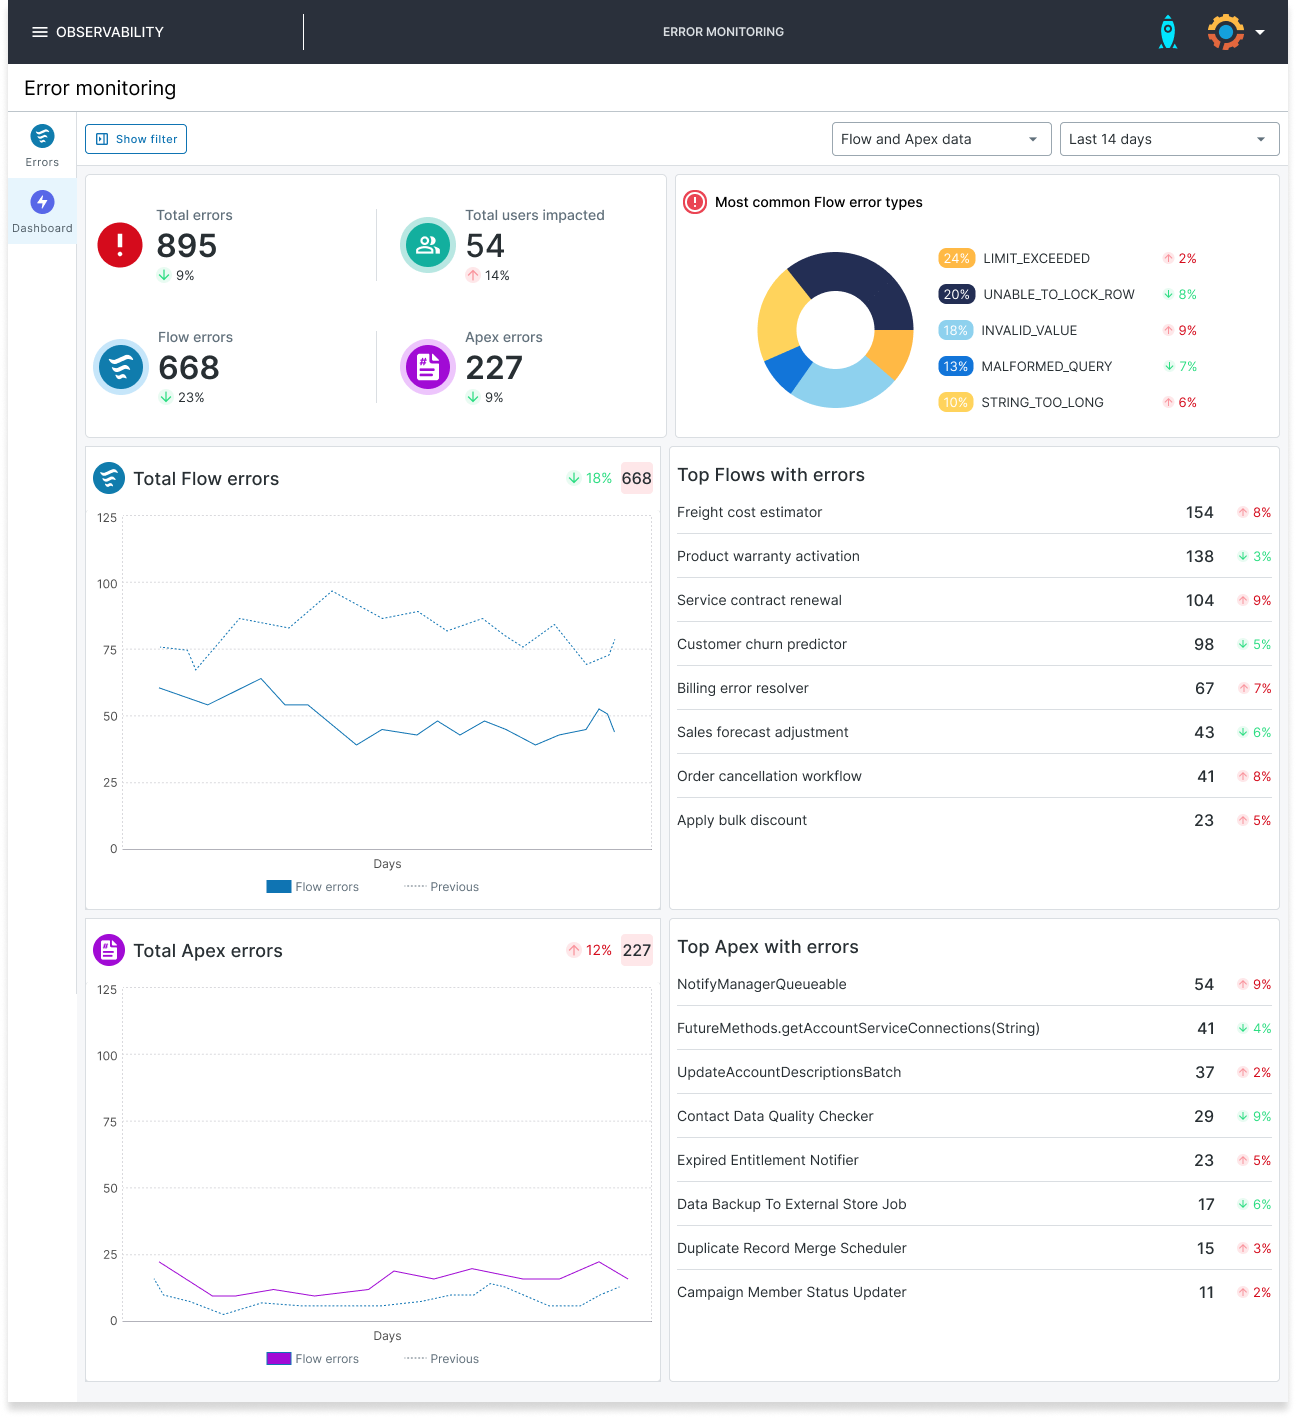
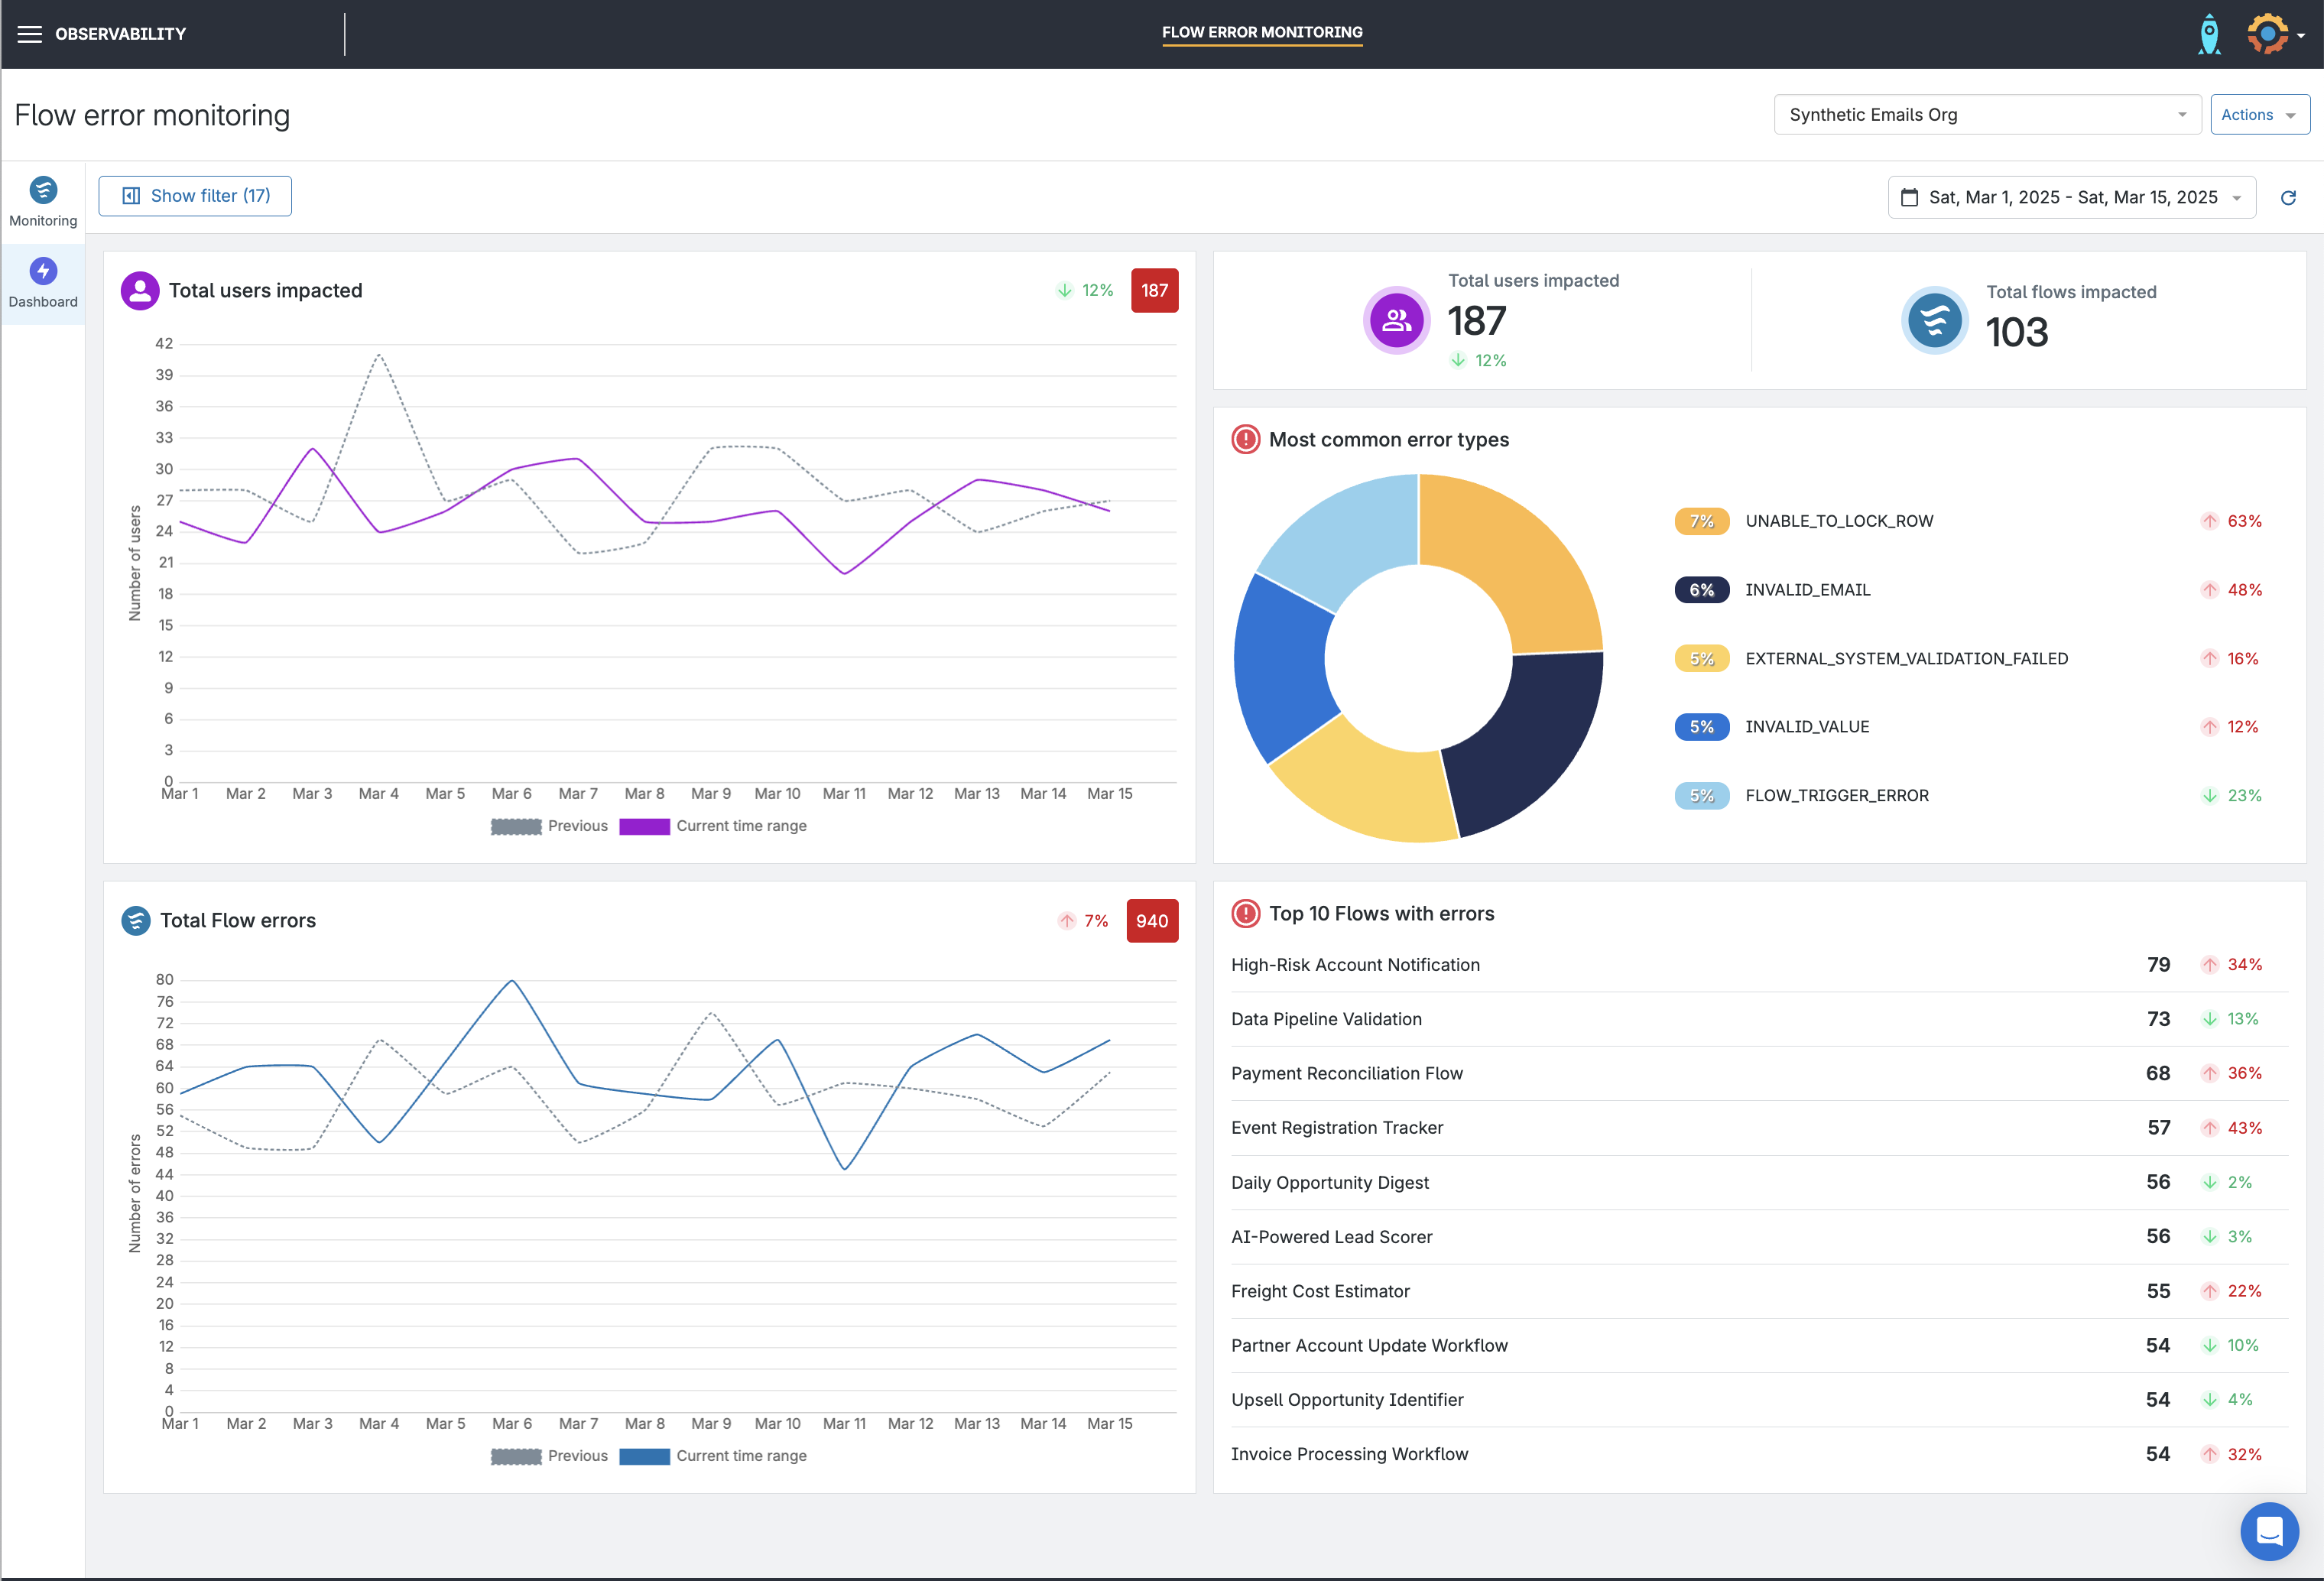
Performance dashboard
As Flow and Apex errors occur, key performance metrics are displayed on Gearset’s intuitive dashboard, giving you complete visibility over error activity. The dashboard includes:
- A visualization of impacted users and when errors occurred over any chosen time range.
- A breakdown of the most common error types causing Flow errors.
- A list of your top 10 worst Flow and Apex errors.
- Total number of impacted users and error counts across both Flows and Apex.
Spot errors before they impact users
Gearset begins tracking and recording errors from the moment a monitoring job is created and the first error is detected. Flow and Apex errors are plotted across your selected time range, helping you spot trends or spikes worth investigating.
You can:
- Filter errors by date using preset ranges or custom selections.
- Click, drag and zoom across the timeline to quickly focus on a specific period.
- See all your deployments plotted alongside the errors to pinpoint changes that may have caused them.
- Use free‑text search to find any Flow name or Apex component, element, or error type, with the timeline updating dynamically based on your search.
- View total error counts across all Flows and Apex, or drill down to individual errors when applying a specific Flow or Apex filter.
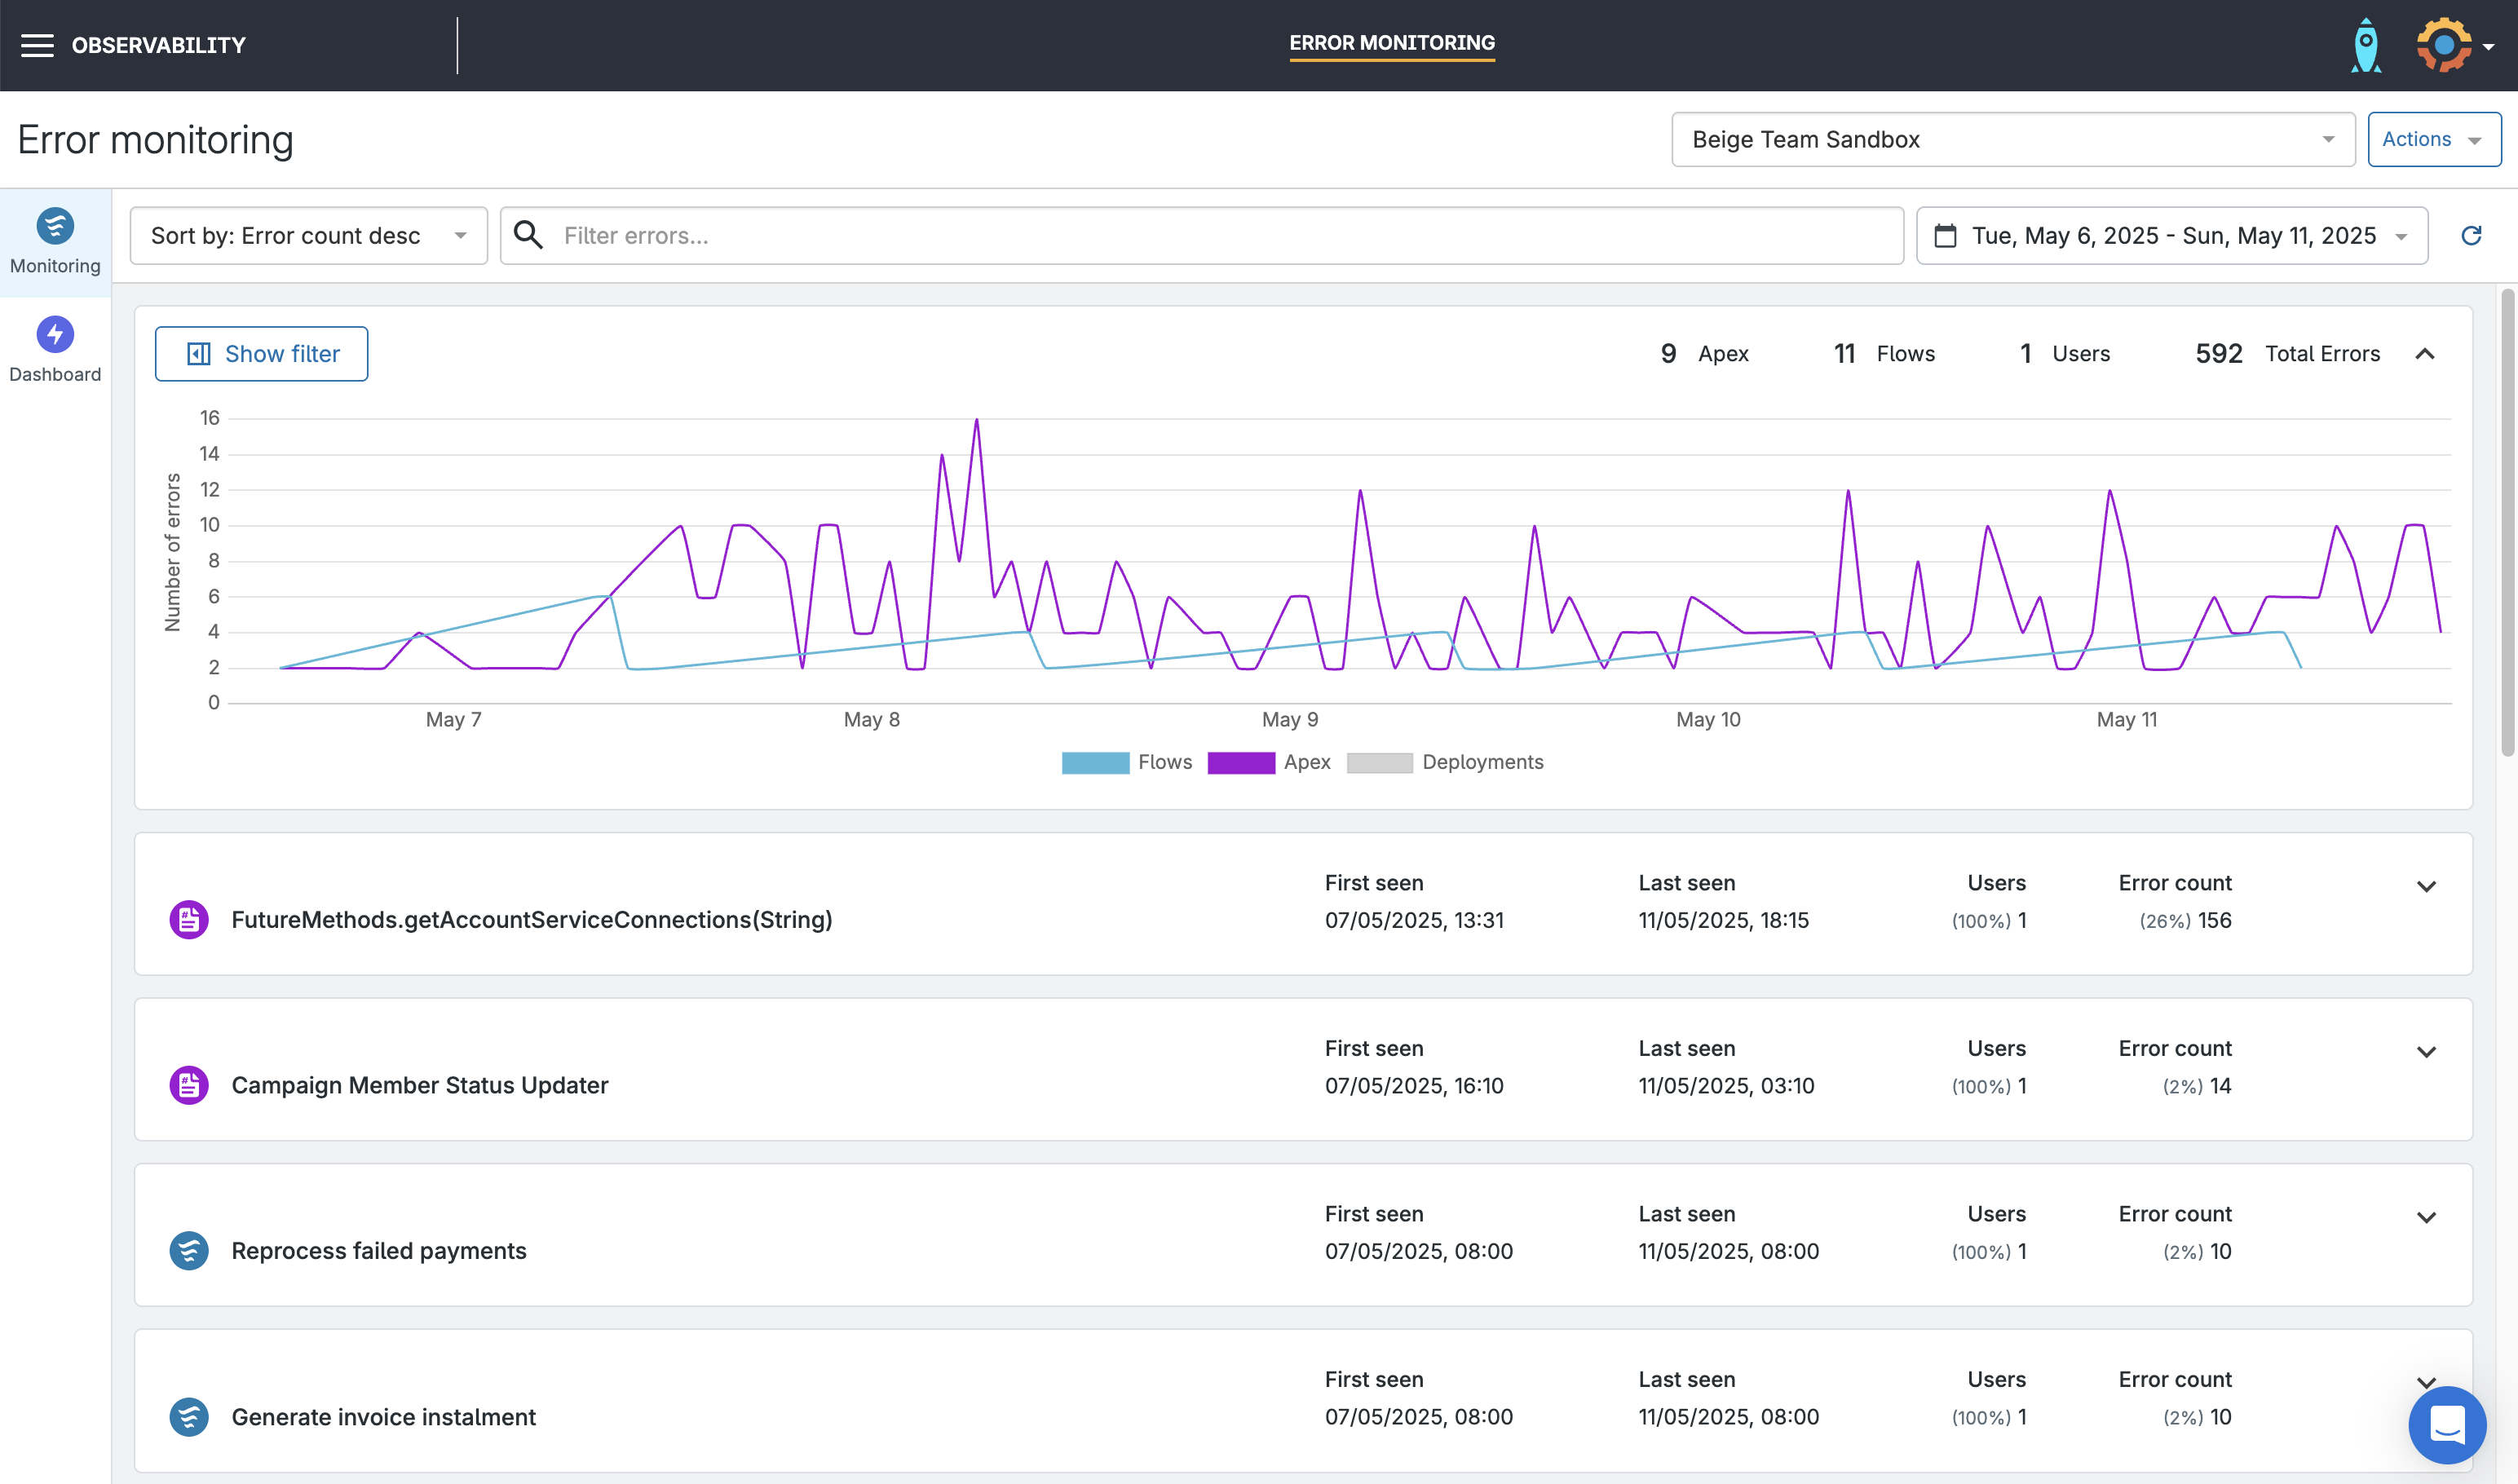
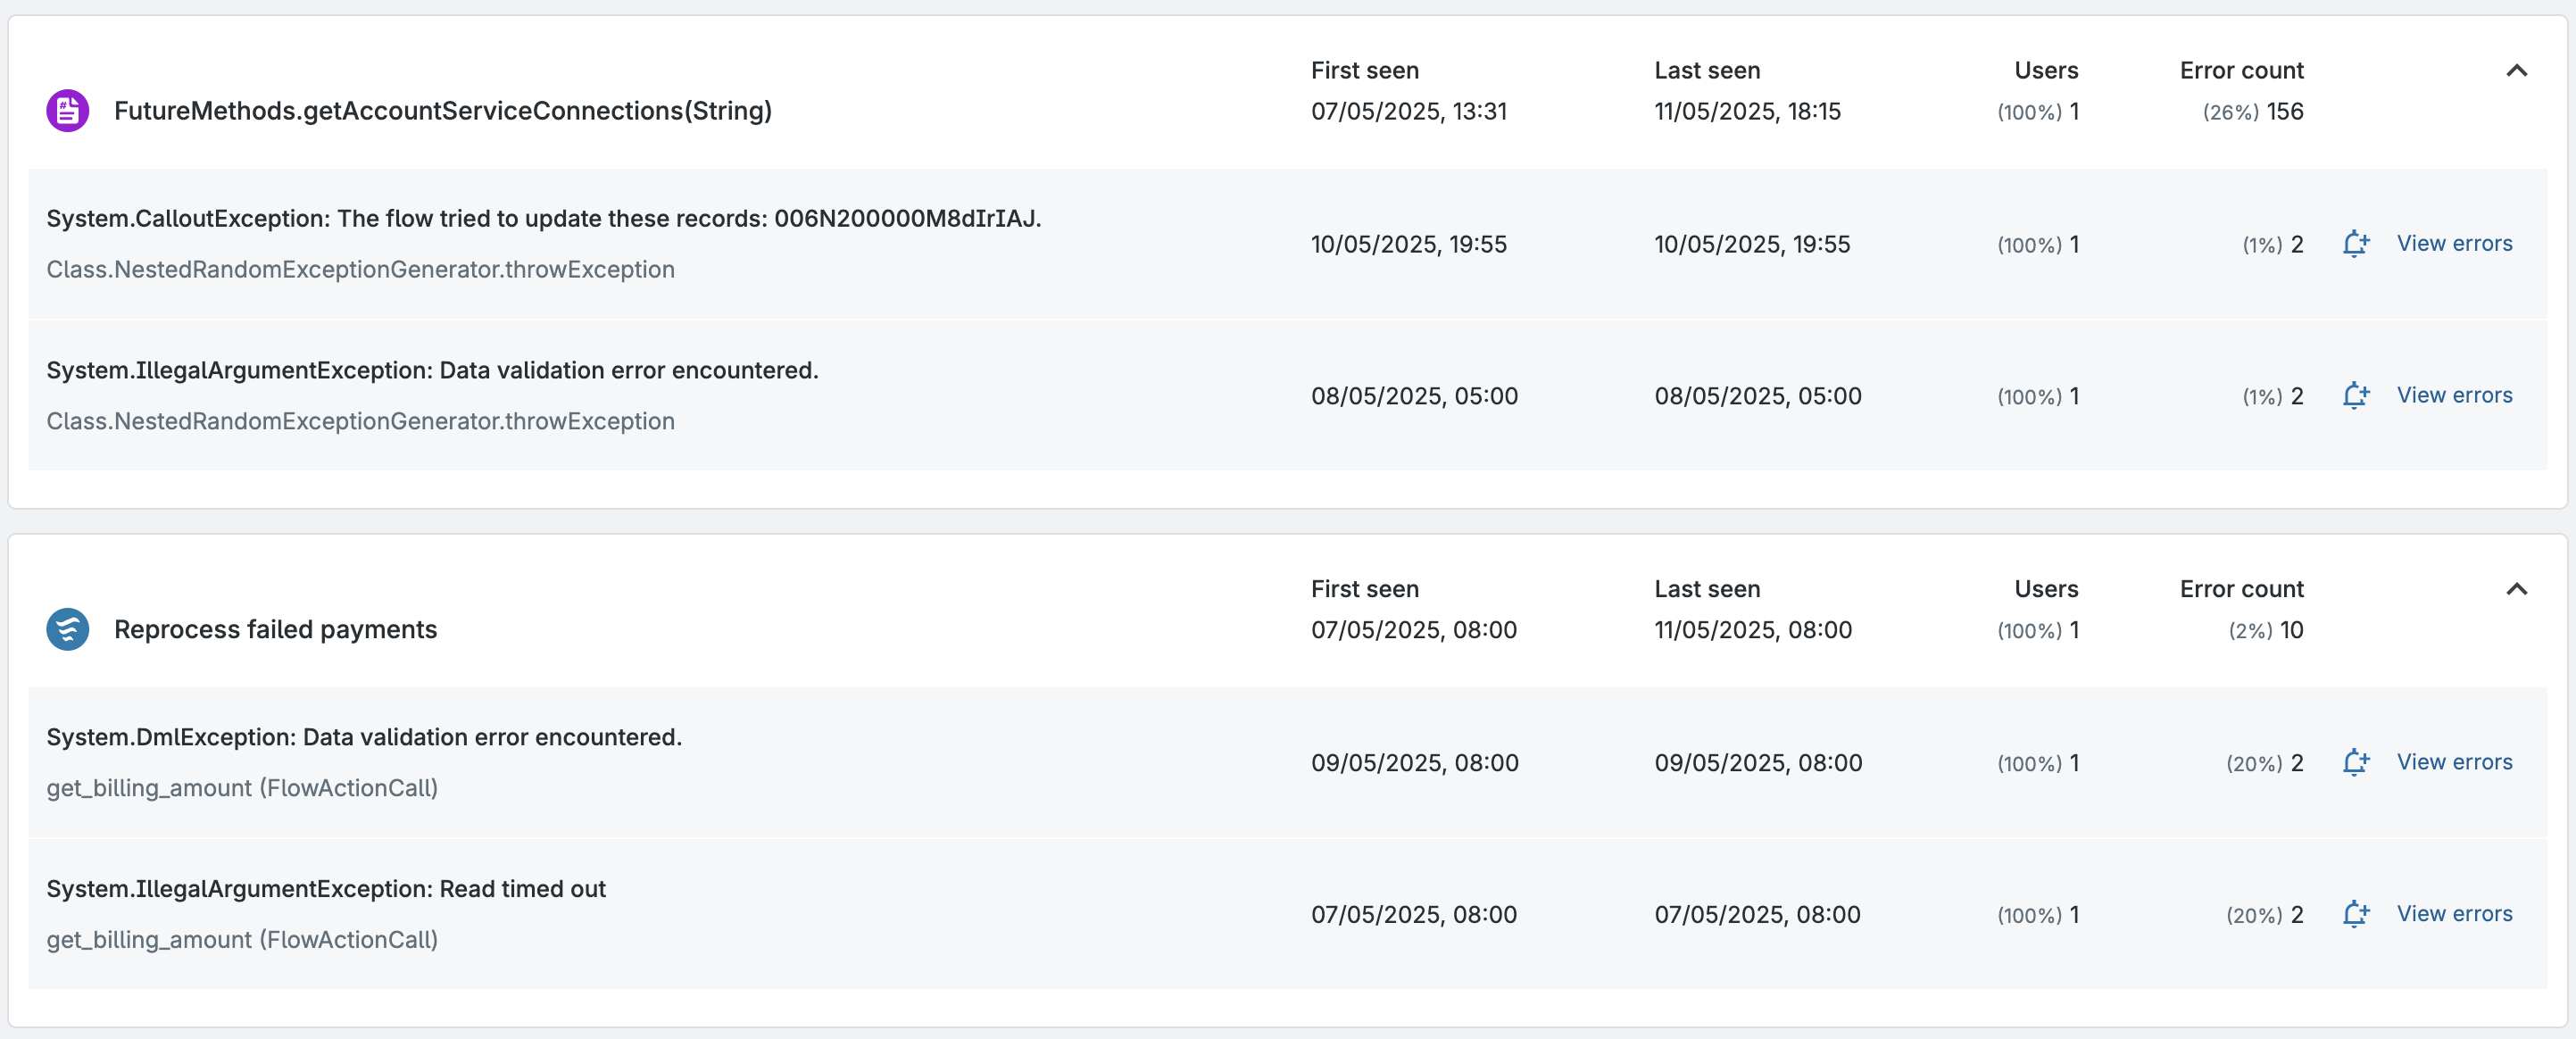
Error results
Errors are grouped by Flow name or Apex category, with expandable sections that reveal detailed breakdowns of error types and instances.
Each group shows:
- First seen: The earliest recorded occurrence within your selected time range.
- Last seen: The most recent occurrence recorded within your chosen time range, again considering when the job was created.
- Users: The count of distinct users who triggered the error (based on the Flow interview’s current user).
- Error count: The total number of recorded instances of the error.
Expanding an Apex group reveals the specific errors and associated namespace or method, along with date information, error counts, and impacted user metrics.
Expanding a Flow group reveals details about problem types and Flow elements, with metrics like dates, counts, and impacted users.
You can also click View errors to access specific error reports, with numbers and percentages shown in relation to that Flow.
Ready to take control of Apex errors?
Apex errors don’t have to slow your team down or disrupt your users. With Gearset’s error monitoring, you’ll gain full visibility into Flow and Apex issues as soon as they happen. Get real‑time alerts, track error trends over time, and dive into detailed diagnostics so you can pinpoint the root cause and resolve problems before they impact your business.
Empower your team to work proactively, ship with confidence, and keep your Salesforce org running at its best. Start a 30-day free trial of Gearset today.
