
Many Salesforce DevOps teams want to track their performance closely. Without measuring progress, it’s hard to identify what’s working and what needs improvement. This is where DORA metrics come in very handy.
Measuring your performance is good for keeping you on track, but it also helps you to tell a powerful story about your Salesforce ROI — something that can be vital in proving the business value of DevOps.To secure budget for DevOps tools and training, you need data to back your case.
In this post, we’ll look at what the DORA metrics are and how they can help your team and wider business see success with DevOps.
What are DORA metrics?
Google’s DevOps Research and Assessment DORA team has been at the forefront of DevOps research since 2014, tracking and reporting on the performance of teams across all industries who practice DevOps. DORA seeks to understand the factors that help or hinder DevOps improvements.
Most teams reach for the DORA metrics to measure their DevOps performance. These metrics are the most accurate way to assess their progress, and DORA have made it easy to do so by pinpointing four key metrics:
- Deployment Frequency: how often an organization successfully releases to their production environment
- Lead Time for Changes: the amount of time it takes a feature to get into production
- Failed deployment recovery time: the time it takes to recover from a failed deployment to production
- Change Failure Rate: the percentage of deployments causing a failure in production
Although the DORA metrics are designed as a complete DevOps assessment, we can group them in pairs to measure velocity and resilience. Let’s look at these metrics in a little more detail:
Deployment Frequency
Deployment Frequency measures how often your team successfully releases to production and is a key indicator of DevOps maturity. High-performing teams release small, incremental changes more frequently — ideally daily, though more than once a week is still good. Weekly or fortnightly deployments are typical, while anything less frequent may indicate poor performance. In fact, only 10% of teams release daily, as highlighted in our 2022 report, showing that reaching elite performance remains a challenge.
If your deployment frequency is low, it’s crucial to identify the root cause. Are your deployments slow and painful, causing delays? In this case, adopting a smart metadata deployment solution like Gearset can streamline the process. Releasing more often also requires a cultural shift: smaller, more frequent releases are easier to troubleshoot and align with the evolving needs of sophisticated Salesforce setups. The skyrocketing adoption of DevOps within the Salesforce ecosystem reflects the pressing need for better release management practices to meet the increasing workload.
Change Lead Time
The inability to keep up with demand from the business is not only impacted by the frequency of deployments but also by the speed of delivery. Change Lead Time measures the time it takes for committed code to reach production. The most efficient DevOps teams have a short lead time for changes — between a day and a week is good; less than a day is excellent.
If your lead times are low, what should your team do? The problem could be that work takes a long time to get through the release pipeline. In this case, your team should aim to figure out where in the pipeline things slow down, and what can be done about it. For example, if your team is getting slowed down by merge conflicts, then your feature branches should be more focused and short-lived. Are bugs and errors being caught late on in the process? Then testing earlier in the release cycle will help. Are CI jobs stalling? This could be all sorts of things, but a reliable and scalable Salesforce CI/CD solution will help!
Failed Deployment Recovery Time
Failed Deployment Recovery Time is an essential metric because failures are never entirely avoidable — no matter how sophisticated your process. If your team takes less than a day to recover, you’re doing well, and more than one week leaves room for improvement.
Your team’s results for this metric will show how robust your systems for rollback are built, how closely you’re monitoring production, and whether you’re prioritizing recovery enough or too little when there’s a failure. A vital step in surviving a data disaster is having a comprehensive backup solution for Salesforce in place ready for when you need it — not if. Since adopting DevOps also means adapting to a different mindset, and finding the right tools and processes, focusing on the positives will help the cultural shift towards reaching DevOps maturity.
Change Failure Rate
To measure how your team’s time is divided between debugging, building new features, and testing, look at your Change Failure Rate. This metric is a calculation of the percentage of releases that resulted in rollbacks or any type of production failure. The lower the percentage, the greater the likelihood that your team is producing better quality work and more stable deployments. Usually 0-10% is excellent, 10-25% is good, and more than 50% is bad.
If your team is struggling with a high change failure rate then testing work in a dedicated environment, such as UAT or QA, is vital. A high change failure rate might suggest that you need to get your team’s orgs more in sync. If the UAT or QA don’t look that similar to production, then testing is less likely to catch all the edge cases that the work will encounter in production. The metadata needs to be in sync between these orgs. But teams also need to have realistic data in that org for testing, which is where sandbox seeding is super useful.
Standardizing Salesforce delivery in Manufacturing: Lessons from a release team
The benefits of using the DORA metrics
A common theme among the teams we work with at Gearset is understanding how they can mature performance. Oftentimes, these teams don’t have a way to measure DevOps performance. Choosing to track and implement DORA metrics is a fantastic place to start for these teams and highlight areas to improve performance that will provide the most value.
If your team falls in the low performer category with any metric, successfully implementing more automated processes is the key — and that’s both a cultural and technical challenge. Further DevOps adoption will accelerate your deployments, increase release velocity, and reduce downtime and errors. All of this means you’re serving your end users better.
The benefits of using DORA metrics to measure performance are two-fold: you can track your team’s progress, and they’re an excellent tool to explain the business value of DevOps. Both of these things together demonstrate the overarching benefit of DevOps: allowing developers, business stakeholders, and end users to collaborate more easily, and ensuring continuous performance improvements in the agility, velocity, resilience of your team’s development and release management process.
Being able to report on your process performance metrics will prove valuable too if your company is looking to IPO or be acquired.
What is the DORA report?
Gearset is proud to sponsor the 2024 DORA Report! This year’s report reveals several key findings that shed light on how development teams are operating. It covers the continued rise of elite performers, the impact of artificial intelligence on delivery teams, the growing importance of security in the software delivery lifecycle, and the critical role of cultural practices in driving team success.
Insights from the 2024 DORA report
We’ve already looked at the 2024 DORA report in full over on the learning platform, DevOps Launchpad so we won’t go look at the report in depth here. Instead, we’ve chosen a few of the key insights.
It’s perhaps a little unsurprising that this year’s report focussed much on the impact of artificial intelligence (AI) on software development. While the report found that 75% of teams rely on AI for at least one part of their day-to-day job, trust in AI itself is fragile. Teams also reported that AI has had a negative impact on their performance metrics.
The report emphasizes that a great developer experience is vital for team success. It highlights automated processes as essential for improving DevOps metrics, despite the cultural challenges. According to the DORA report, adopting such technology and processes significantly enhances daily workflows.
How can Salesforce teams track their performance using the DORA metrics?
The DORA metrics have been applied to traditional software delivery processes across other technologies, but they can be applied to Salesforce, too. There are other metrics to consider when developing on the Salesforce platform — such as code quality and deployment time — nevertheless, DORA is easy to get started with.
If you’re already using Gearset, you’re in luck. Our Reporting API lets you extract data from Gearset that shows how your team is doing in terms of the DORA metrics, helping you to assess your DevOps maturity accurately.
Gearset can provide you with this data thanks to Pipelines — which you’ll need to have set up to benefit from the Reporting API. Using the Reporting API means you can take your team’s DORA metrics and analyze the data in your preferred dashboard tool — such as Tableau, Grafana, Mulesoft, or Microsoft Power BI.
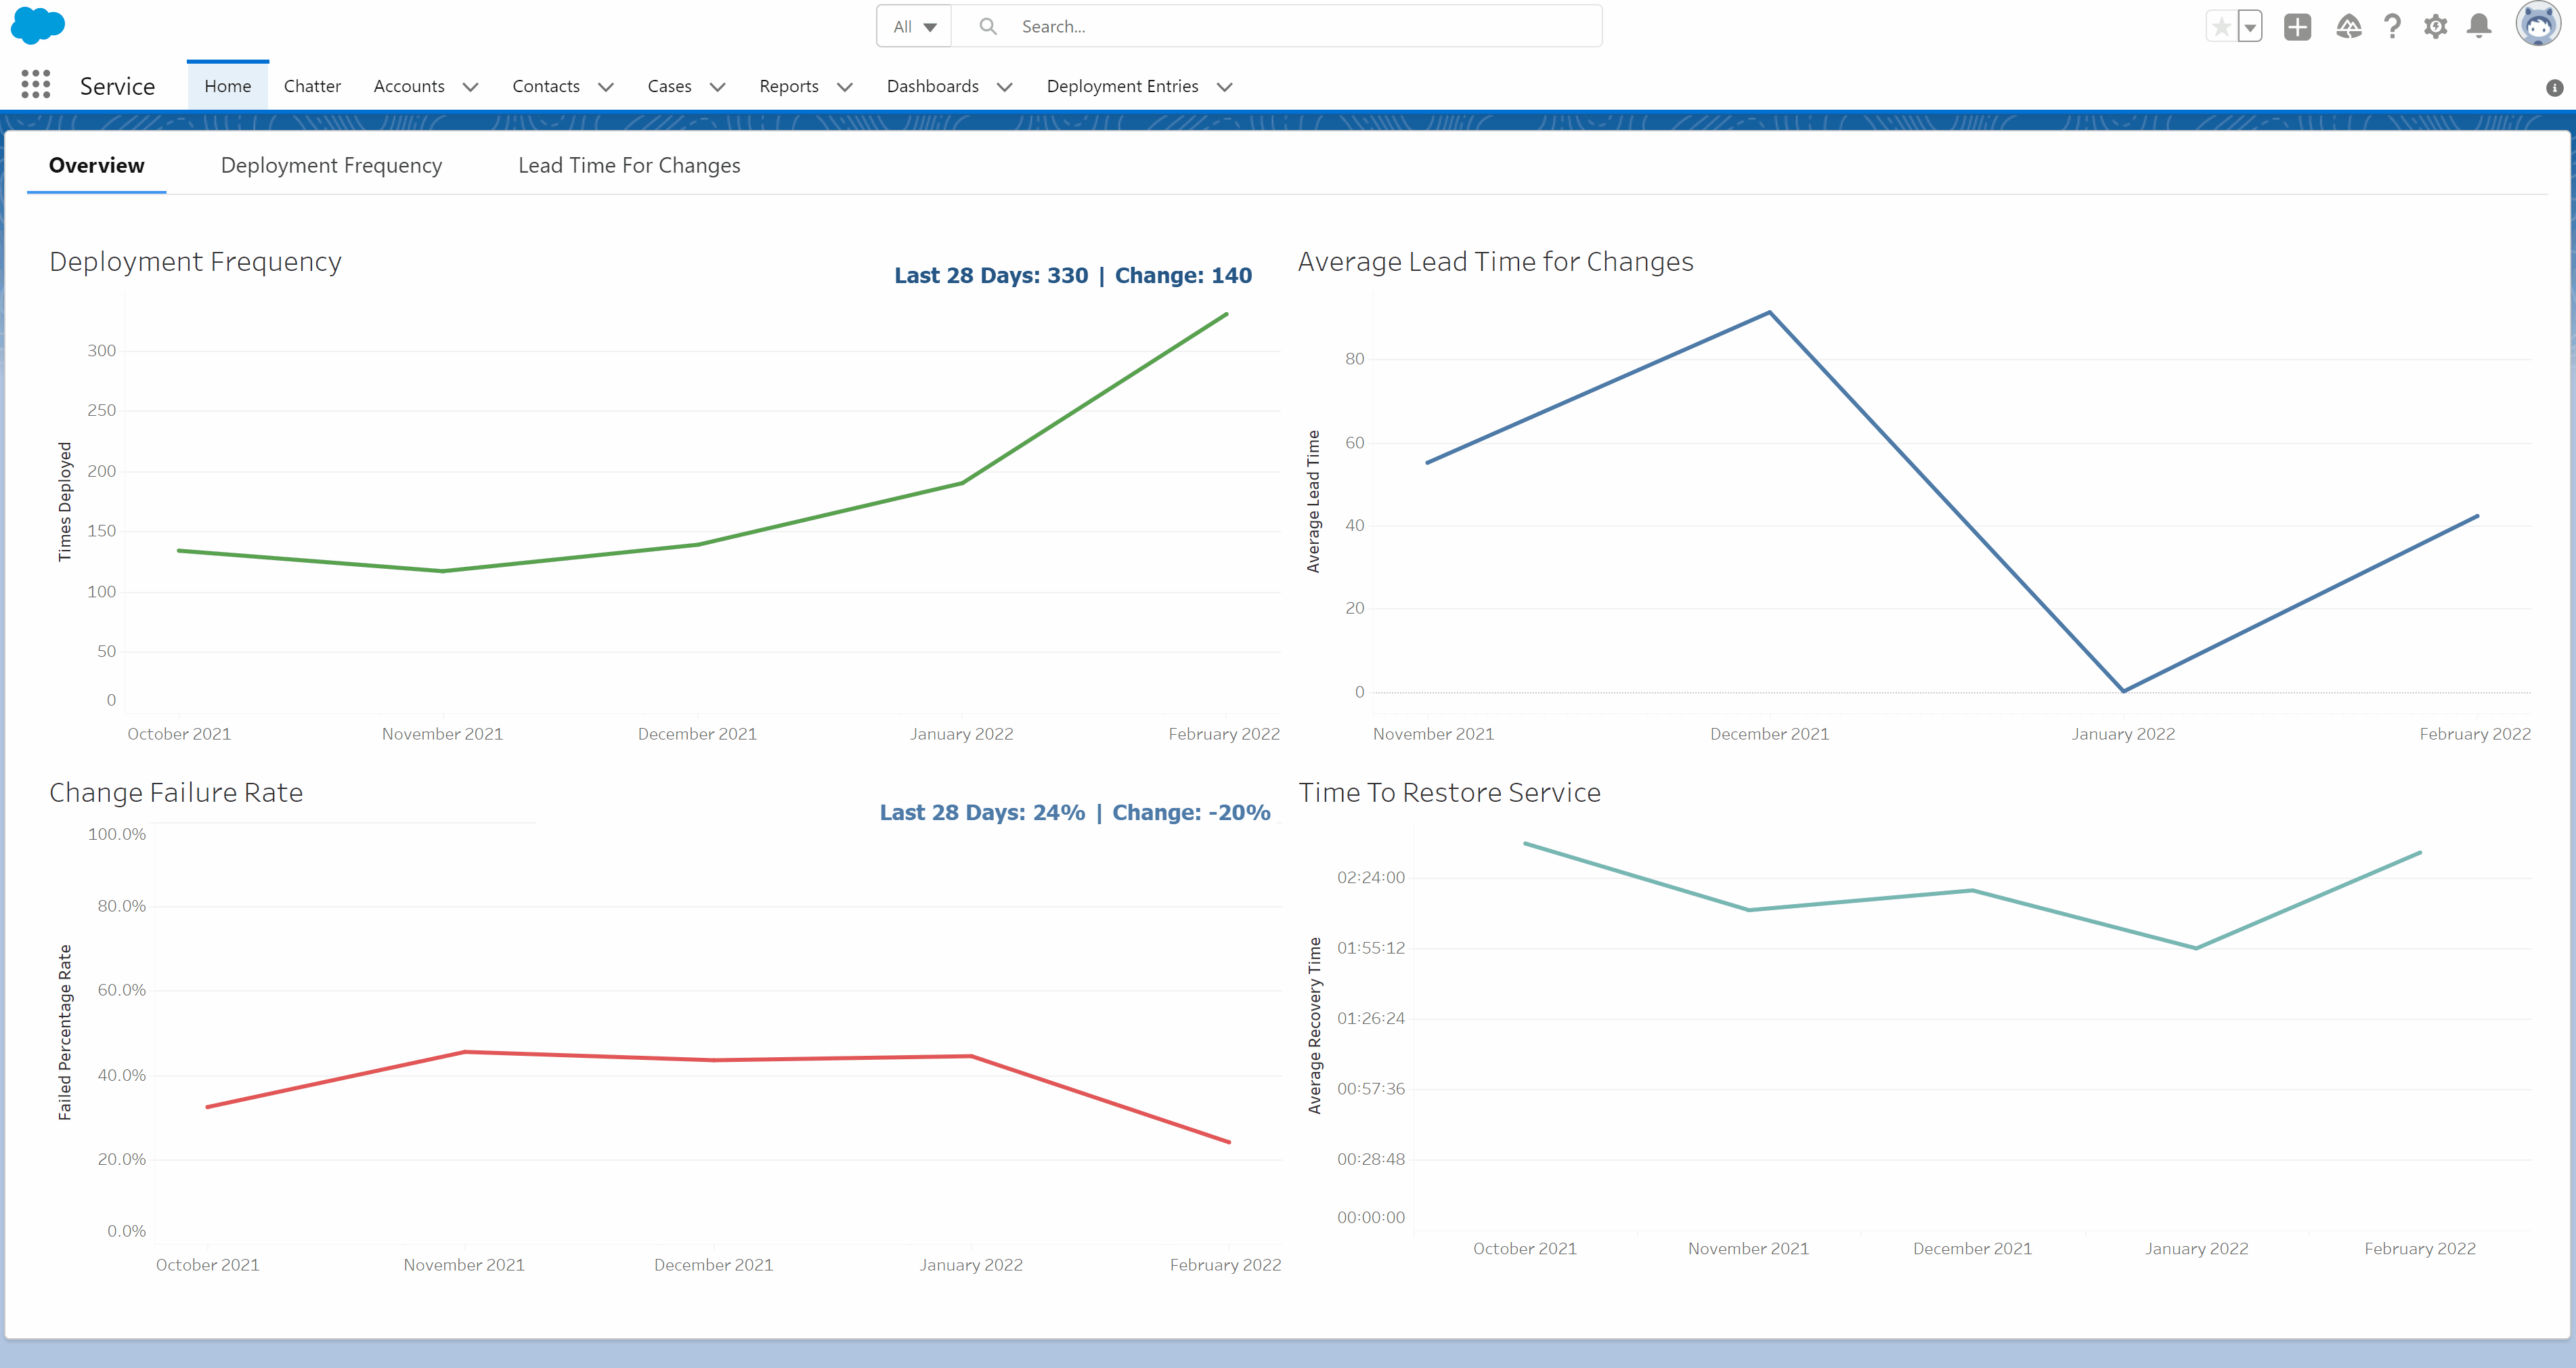
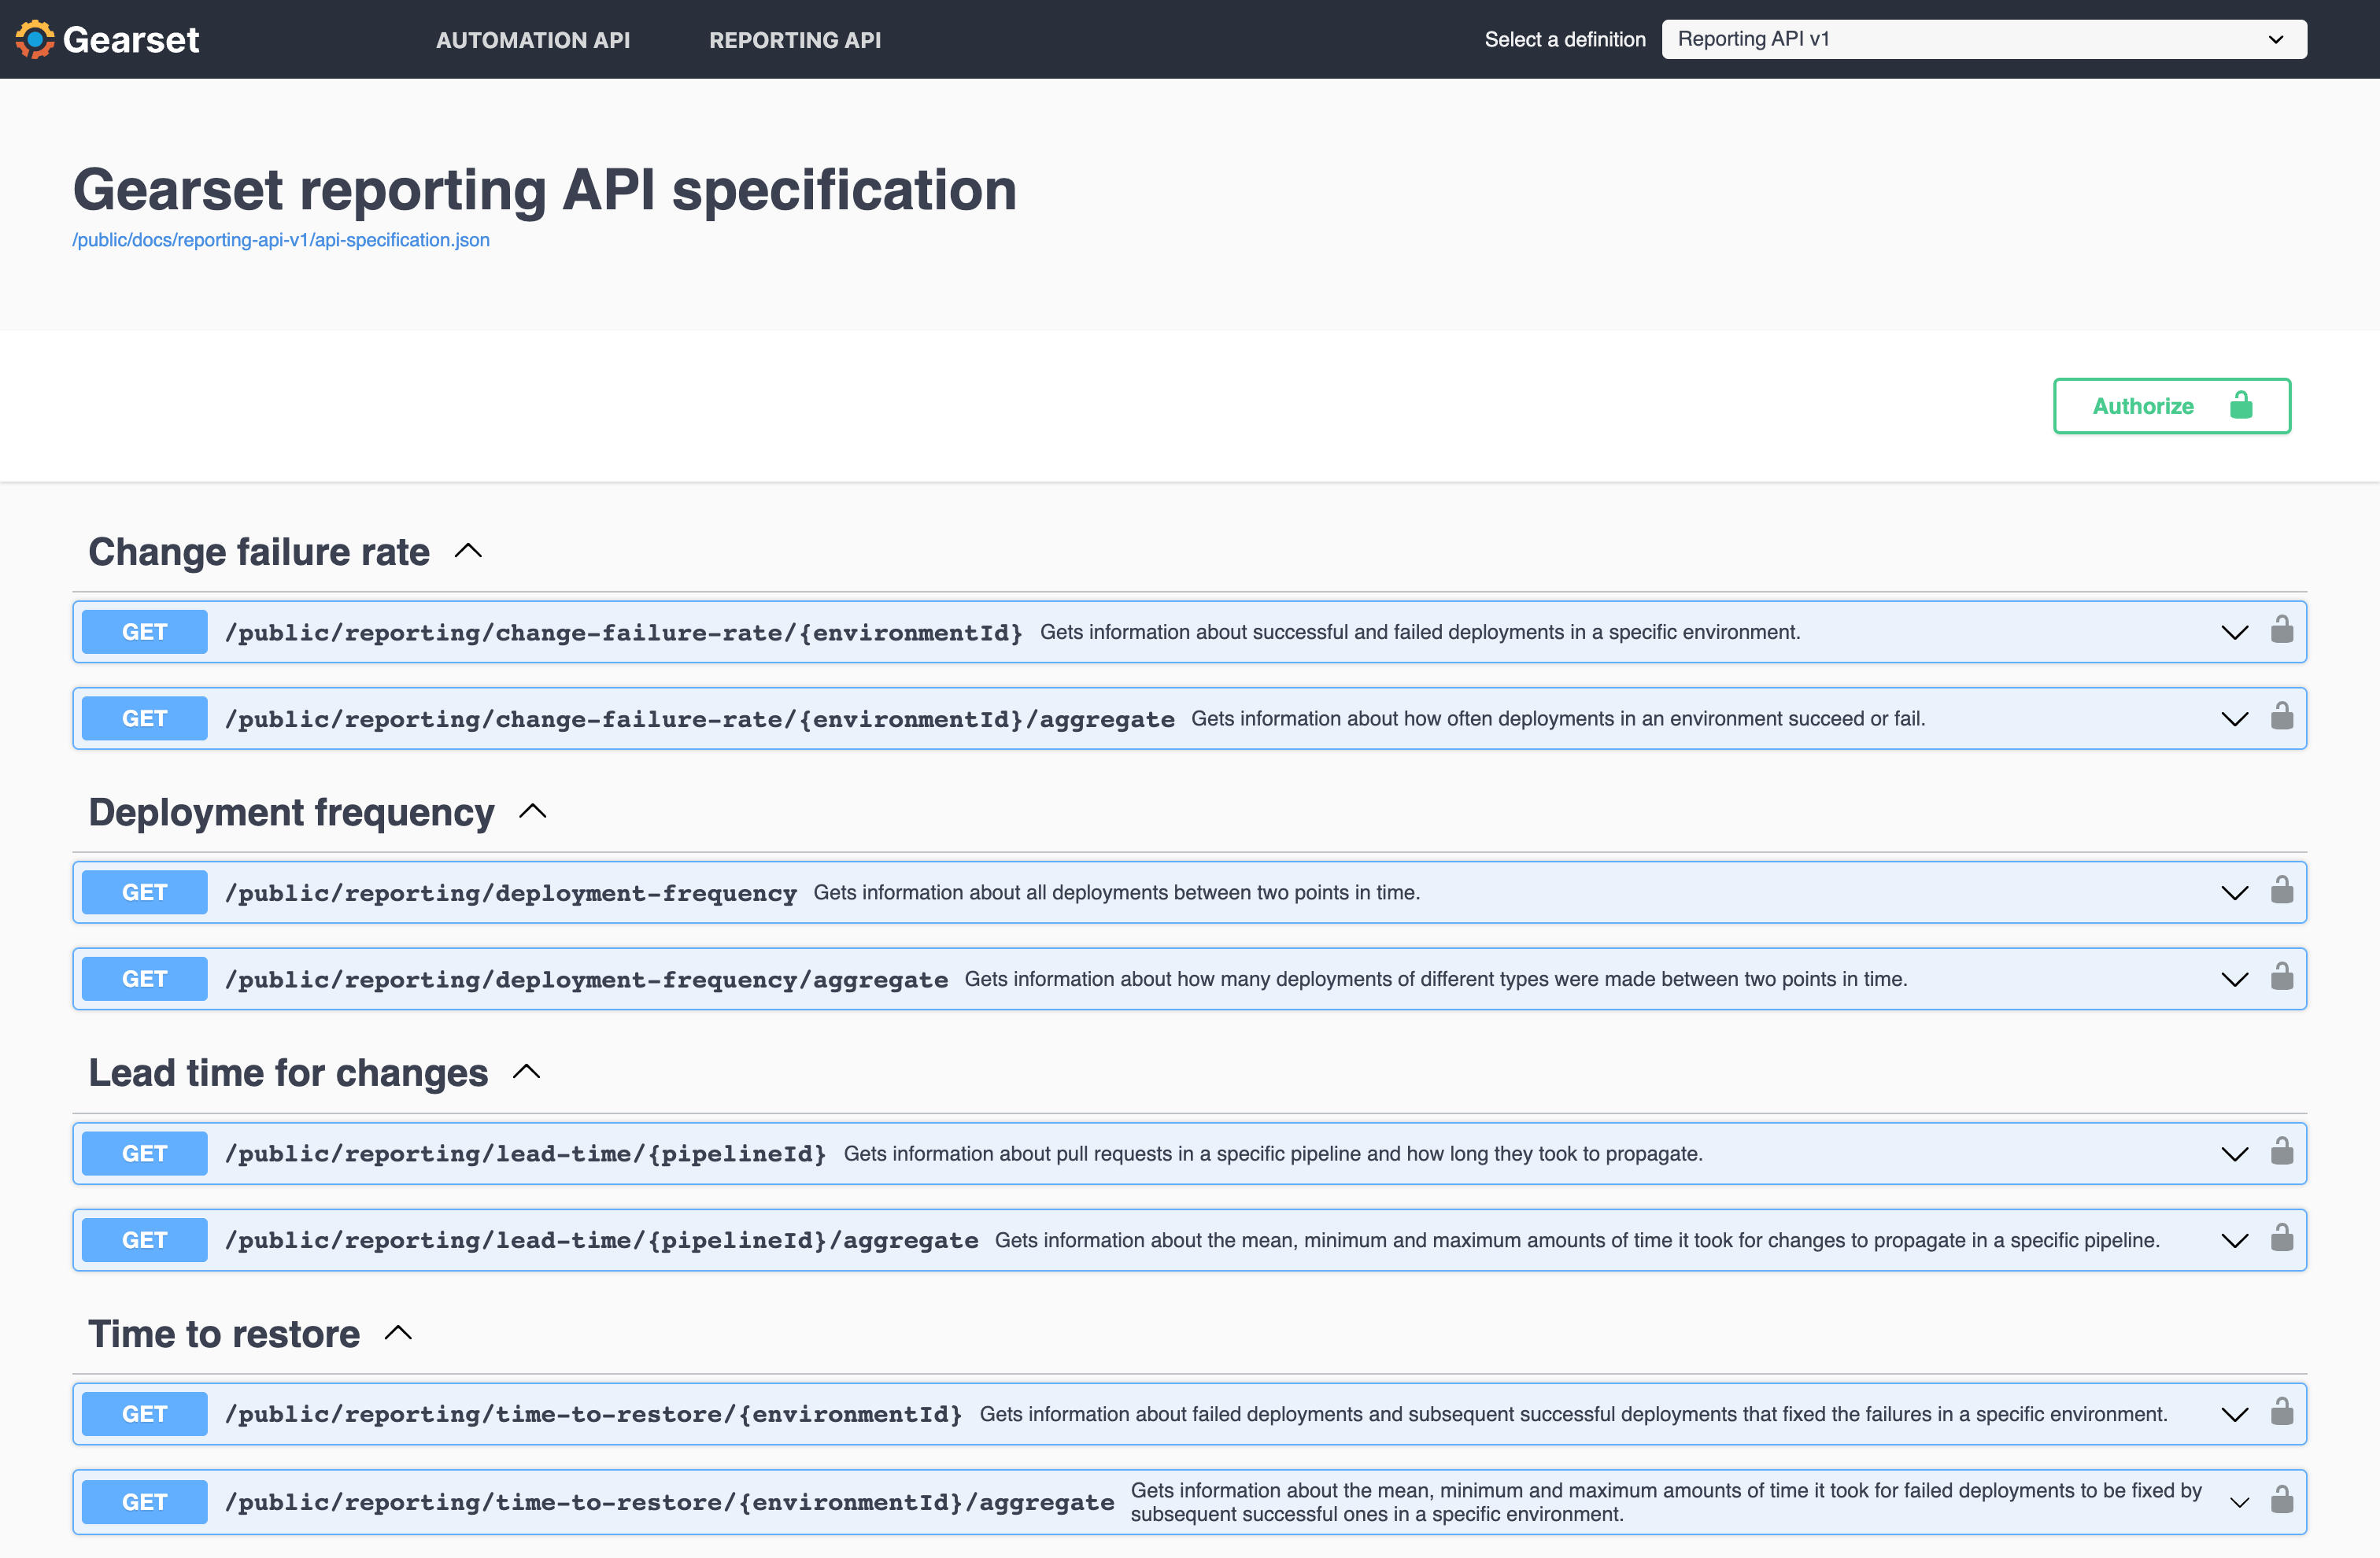
As well as seeing the headline figures for the DORA metrics, you and your team will likely want to dig into the data, so you can do your own analysis of the resilience and velocity of your release process. With this in mind, Gearset exposes two API endpoints for each metric: one providing raw data for calculating the metric and another presenting aggregate information for directly plotting the DORA metric on a line graph.
Using the Reporting API feature
To begin using our Reporting API feature, you’ll need to get an API access token first, which will be used for authentication. Depending on the DORA metric, you’ll need to gather either your pipeline ID or environment ID. Then you’re ready to create a request using the Gearset API dynamic documentation.
Let’s take a look at getting the Lead Time metric, as an example. Head to the Lead Time for Changes section, and click on the Try it out button. Fill in the ID and the time frame to query, and click Execute. This will send off a request to the Reporting API to analyze this metric. Once executed it presents the curl command that was used (so you can use it elsewhere) and the response. This can be copied or downloaded. You can follow this process to get the other three DORA metrics. For all of the metrics apart from Deployment Frequency, you’ll need to be using Pipelines.
See for yourself
If you want to see a demo of the Reporting API using a Tableau dashboard, and learn more about the DORA metrics, watch the recording of our launch webinar now. Or get in touch to book a tailored demo of Gearset for your team.
If you already have the automation tier of Gearset and you’re using Pipelines, our Salesforce CI/CD solution, then you’re all set to make full use of the Reporting API to assess your DevOps performance.
