
An important principle of software development is making sure your tests dig into all the deepest recesses of your code. After all, a mistake could creep into any line - and if a bug only gets triggered by an edge case, it won’t surface for a long time. When it finally does emerge, it’ll be harder to fix because you won’t remember that part of your codebase.
We’ve recently released a new feature that lets you view your code coverage not just class by class, but also line by line.
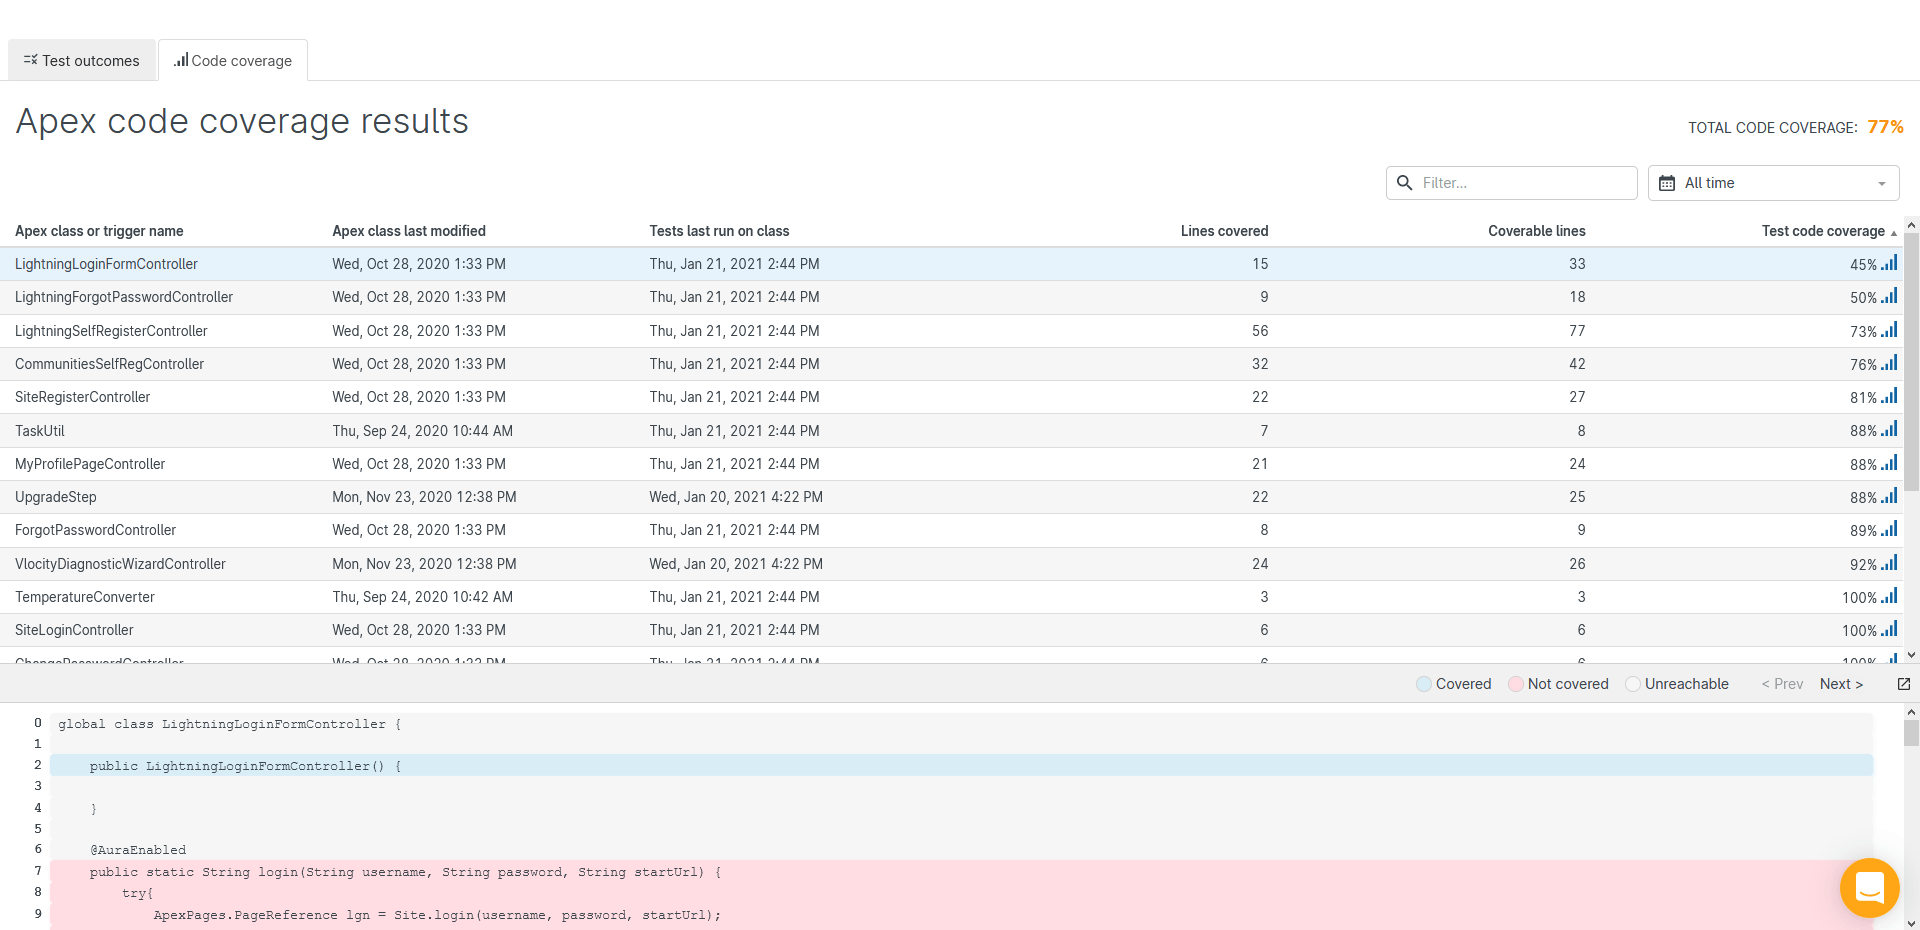
Code coverage by class
Having tests in place that give you good coverage means you’ll run into fewer headaches further down the road, which is why Salesforce requires a minimum 75% Apex code coverage to deploy to production.
Unit testing jobs in Gearset automatically run tests daily and show you the Apex code coverage for each of your classes. At a glance, you can see which of your classes have low coverage and are most at risk of containing bugs. Every time Gearset runs one of your tests, the coverage data is recorded. This gives you the ability to track the coverage history for each class, see what progress has been made, and identify where more work still needs to be done.
To see your code coverage results, navigate to the unit testing dashboard in Gearset and click the View history button. From the Test run history page, click View results to access all the details of any given completed test run.

The Code coverage tab shows you the test details for each of your Apex classes, including their individual code coverage. To find specific classes quickly, you can filter by modification date as well as the class or trigger name.
Line-by-line code coverage
At the bottom of the Code coverage tab, you’ll see a preview of the line-by-line coverage. This is useful when you need to take a quick peek at a specific function or block of code. To take a more detailed look at the entire file, expand the preview pane by clicking the window icon to the right of Next >.
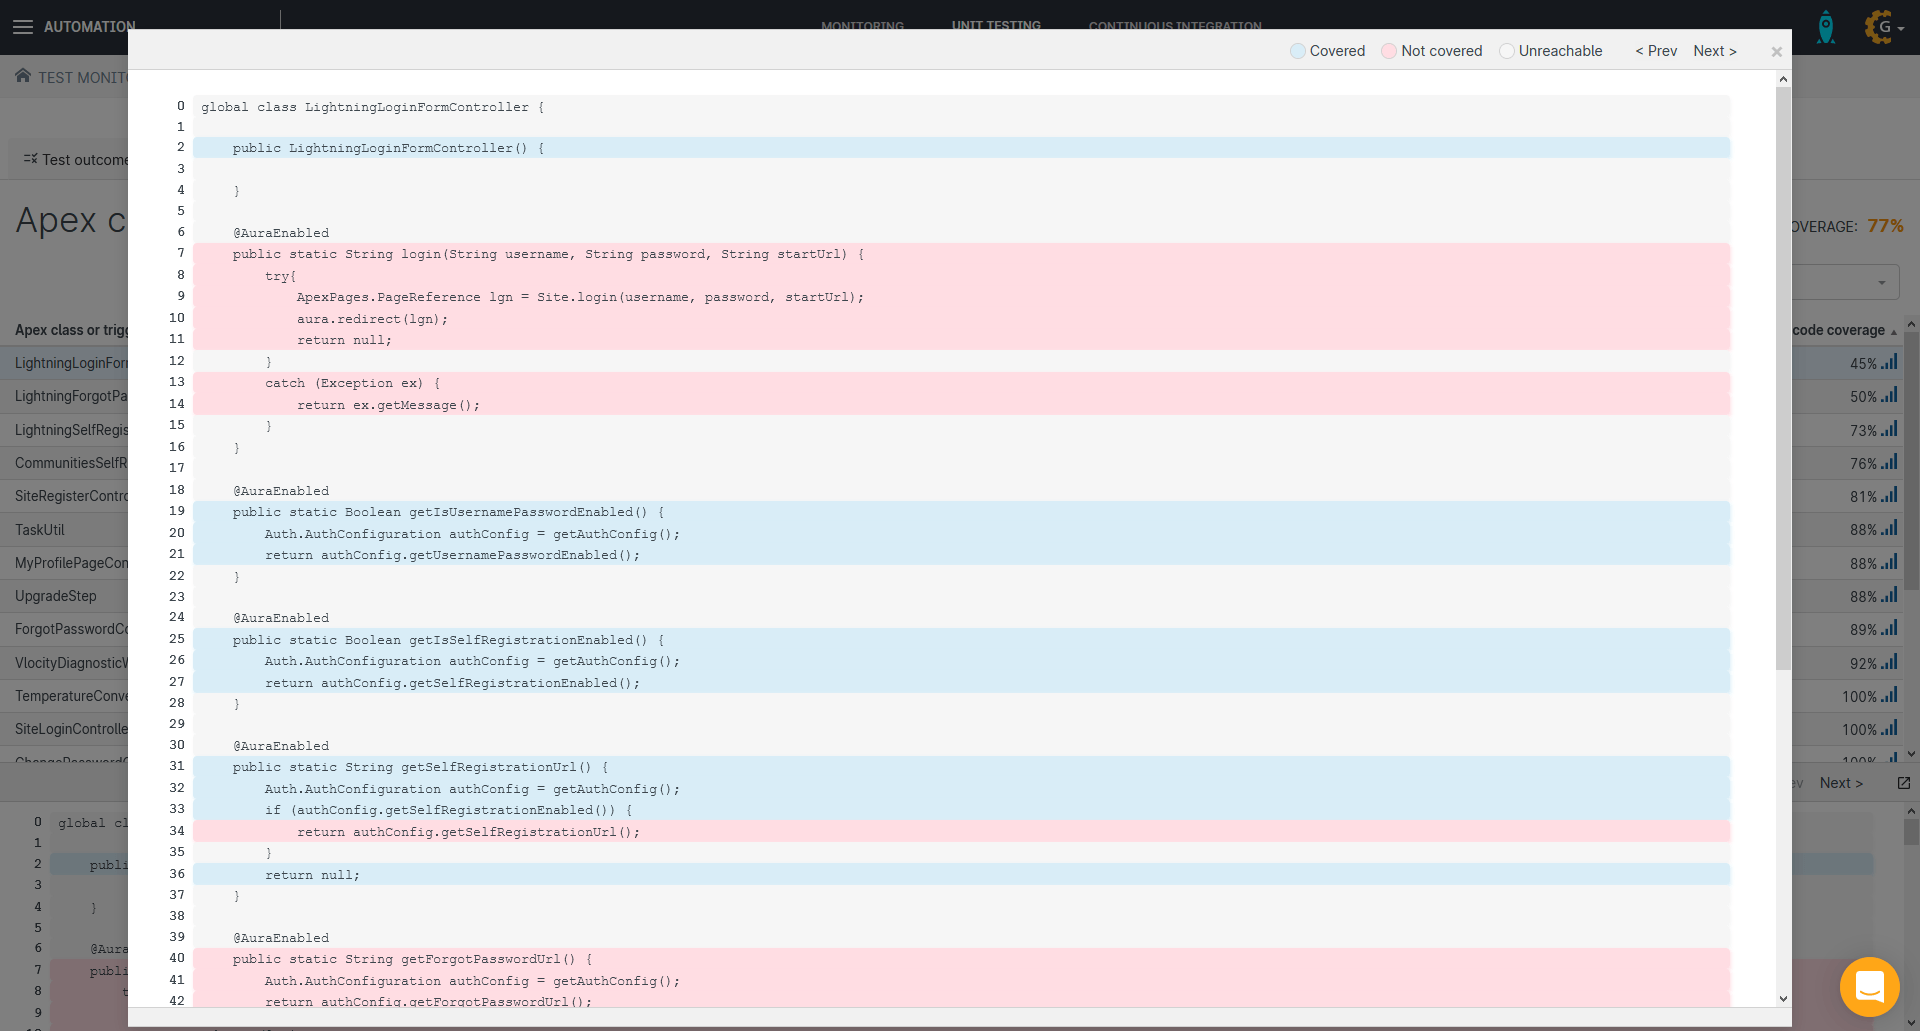
The larger window view makes it easier to see which parts of your Apex code are covered by tests and which ones aren’t. By looking through the classes, you can quickly build up a list of the key methods most in need of more code coverage to make sure they’re functioning correctly. Once you know which lines of code to tackle, it’s just a matter of adding new test methods to check that these lines work as intended.
Virtual Summit: Taking control of complex orgs
Want to dig into your Apex code coverage?
Gearset’s automated unit testing solution can help you to catch errors and code quality issues in your development cycle by digging into your Apex code coverage with automated testing. Start a free 30-day trial to get on top of your Apex and improve your release process, or book a tailored demo of Gearset with one of our experts.
