
When something breaks in your Salesforce DevOps pipeline, monitoring tools can raise the alarm but they don’t explain the cause. Observability fills in the gaps and gives you the context you need to take action.
Together, monitoring and observability strengthen every stage of the DevOps lifecycle. They help you detect issues early, analyze data quickly, and feed lessons back into future releases — leading to faster resolution, more reliable deployments, and continuous improvement across your Salesforce instance.
In this post, we’ll explore how you can make sure your DevOps lifecycle leverages observability and monitoring effectively, from selecting the right tools to turning valuable insights into action.
What is monitoring in Salesforce DevOps?
Monitoring in Salesforce DevOps means tracking deployments, integrations, and performance metrics against set parameters. If a deployment job fails, an API call volume spikes, or response times slow down, monitoring tools alert team members so they can act quickly to protect the stability and reliability of your environment.
Monitoring is reactive — you’re only alerted when known conditions are triggered — but it ensures problems don’t go unnoticed and helps teams deal with issues before they spread.
TDX
What’s the difference between monitoring and change monitoring?
Monitoring keeps you informed about issues in your Salesforce org, while change monitoring reveals what actually changed — helping you understand what caused them.
In Salesforce, problems often stem from metadata, automation, or user permission changes rather than just system performance. By surfacing recent changes, change monitoring gives you the context to link new errors back to the updates that may have introduced them. That way, instead of just knowing “a deployment failed,” you can see that it failed because a workflow rule was altered or because a dependency wasn’t included.
What is observability in Salesforce DevOps?
Observability is about understanding what’s happening inside your Salesforce org by looking at the data it produces. Rather than waiting for alerts to tell you something has gone wrong, observability helps you understand the current state of your org, why issues occur, and how different parts of your system interact.
Teams doing Observability well collect and interpret signals like logs, metrics, and traces. These signals are the external outputs of your system — giving you visibility into how integrations, components, and services behave in real time. With that information, teams can move beyond surface-level symptoms and uncover the chain of events that led to the problem.
For example, observability tools might show that a recently activated Flow is throwing errors whenever users try to create a new opportunity. Instead of finding out later through scattered error emails or user complaints, you see the failures in real time with full error context, so you can investigate and fix the problem before it impacts more users.
“Observability is a cornerstone of any successful Salesforce DevOps strategy. It’s not just about knowing what’s happening in your systems but understanding why it’s happening — so you can fix issues faster, prevent them proactively, and continuously improve how you deliver value.” — Rob Cowell
Observability vs monitoring: key differences
Monitoring and observability work hand in hand, but they’re not interchangeable. Monitoring is the early warning system that spots when something breaks, fails, or drifts beyond the limits you’ve defined. Observability is understanding these warnings, helping you investigate cause and effect, and carry out deeper analysis of the overall health and internal state of your org.
The key difference is in scope. Monitoring is designed around known failure scenarios: thresholds, alerts, and symptoms you can anticipate. Observability is an open-ended comprehensive view. It gives you the tools to ask new questions when unexpected issues come up. This is especially important in Salesforce environments where complex dependencies mean the root cause isn’t always obvious.
| Monitoring | Observability | |
|---|---|---|
| Purpose | Detects when something goes wrong | Explains why something went wrong |
| Approach | Reactive — alerts on known thresholds or failures | Diagnostic — helps you query and understand system behavior |
| Focus | Symptoms (failed deployments, Flow/Apex transactions hitting governor limits, errors) | Root causes (dependencies, metadata changes, hidden patterns) |
| Scope | Predefined scenarios | Open-ended investigation |
| Value | Ensures issues don’t go unnoticed | Reduces guesswork and speeds up resolution |
Why you need both: the benefits of a unified approach
On their own, monitoring and observability are powerful, but together they create a feedback loop that makes Salesforce DevOps more reliable and resilient.
For DevOps teams, this unified approach has clear benefits. You spend less time firefighting and more time solving problems with confidence. You can trace issues back to their source faster, reduce the risk of repeated failures, and use the insights gained to strengthen your release process over time.
Combining the two shifts teams from being reactive to being proactive. Instead of just waiting for the next error alert, you can spot patterns, anticipate issues, and continuously improve the way your Salesforce environment runs.
Top Salesforce observability and monitoring tools
Salesforce’s native tooling won’t give you full visibility into your system health. Debug logs expire quickly, resource limits can terminate transactions without warning, and the multi-tenant architecture of the Salesforce ecosystem often obscures the root cause of issues. That’s why it’s important to be deliberate about monitoring and observability, choosing tools and practices that support your team with clear, actionable insights.
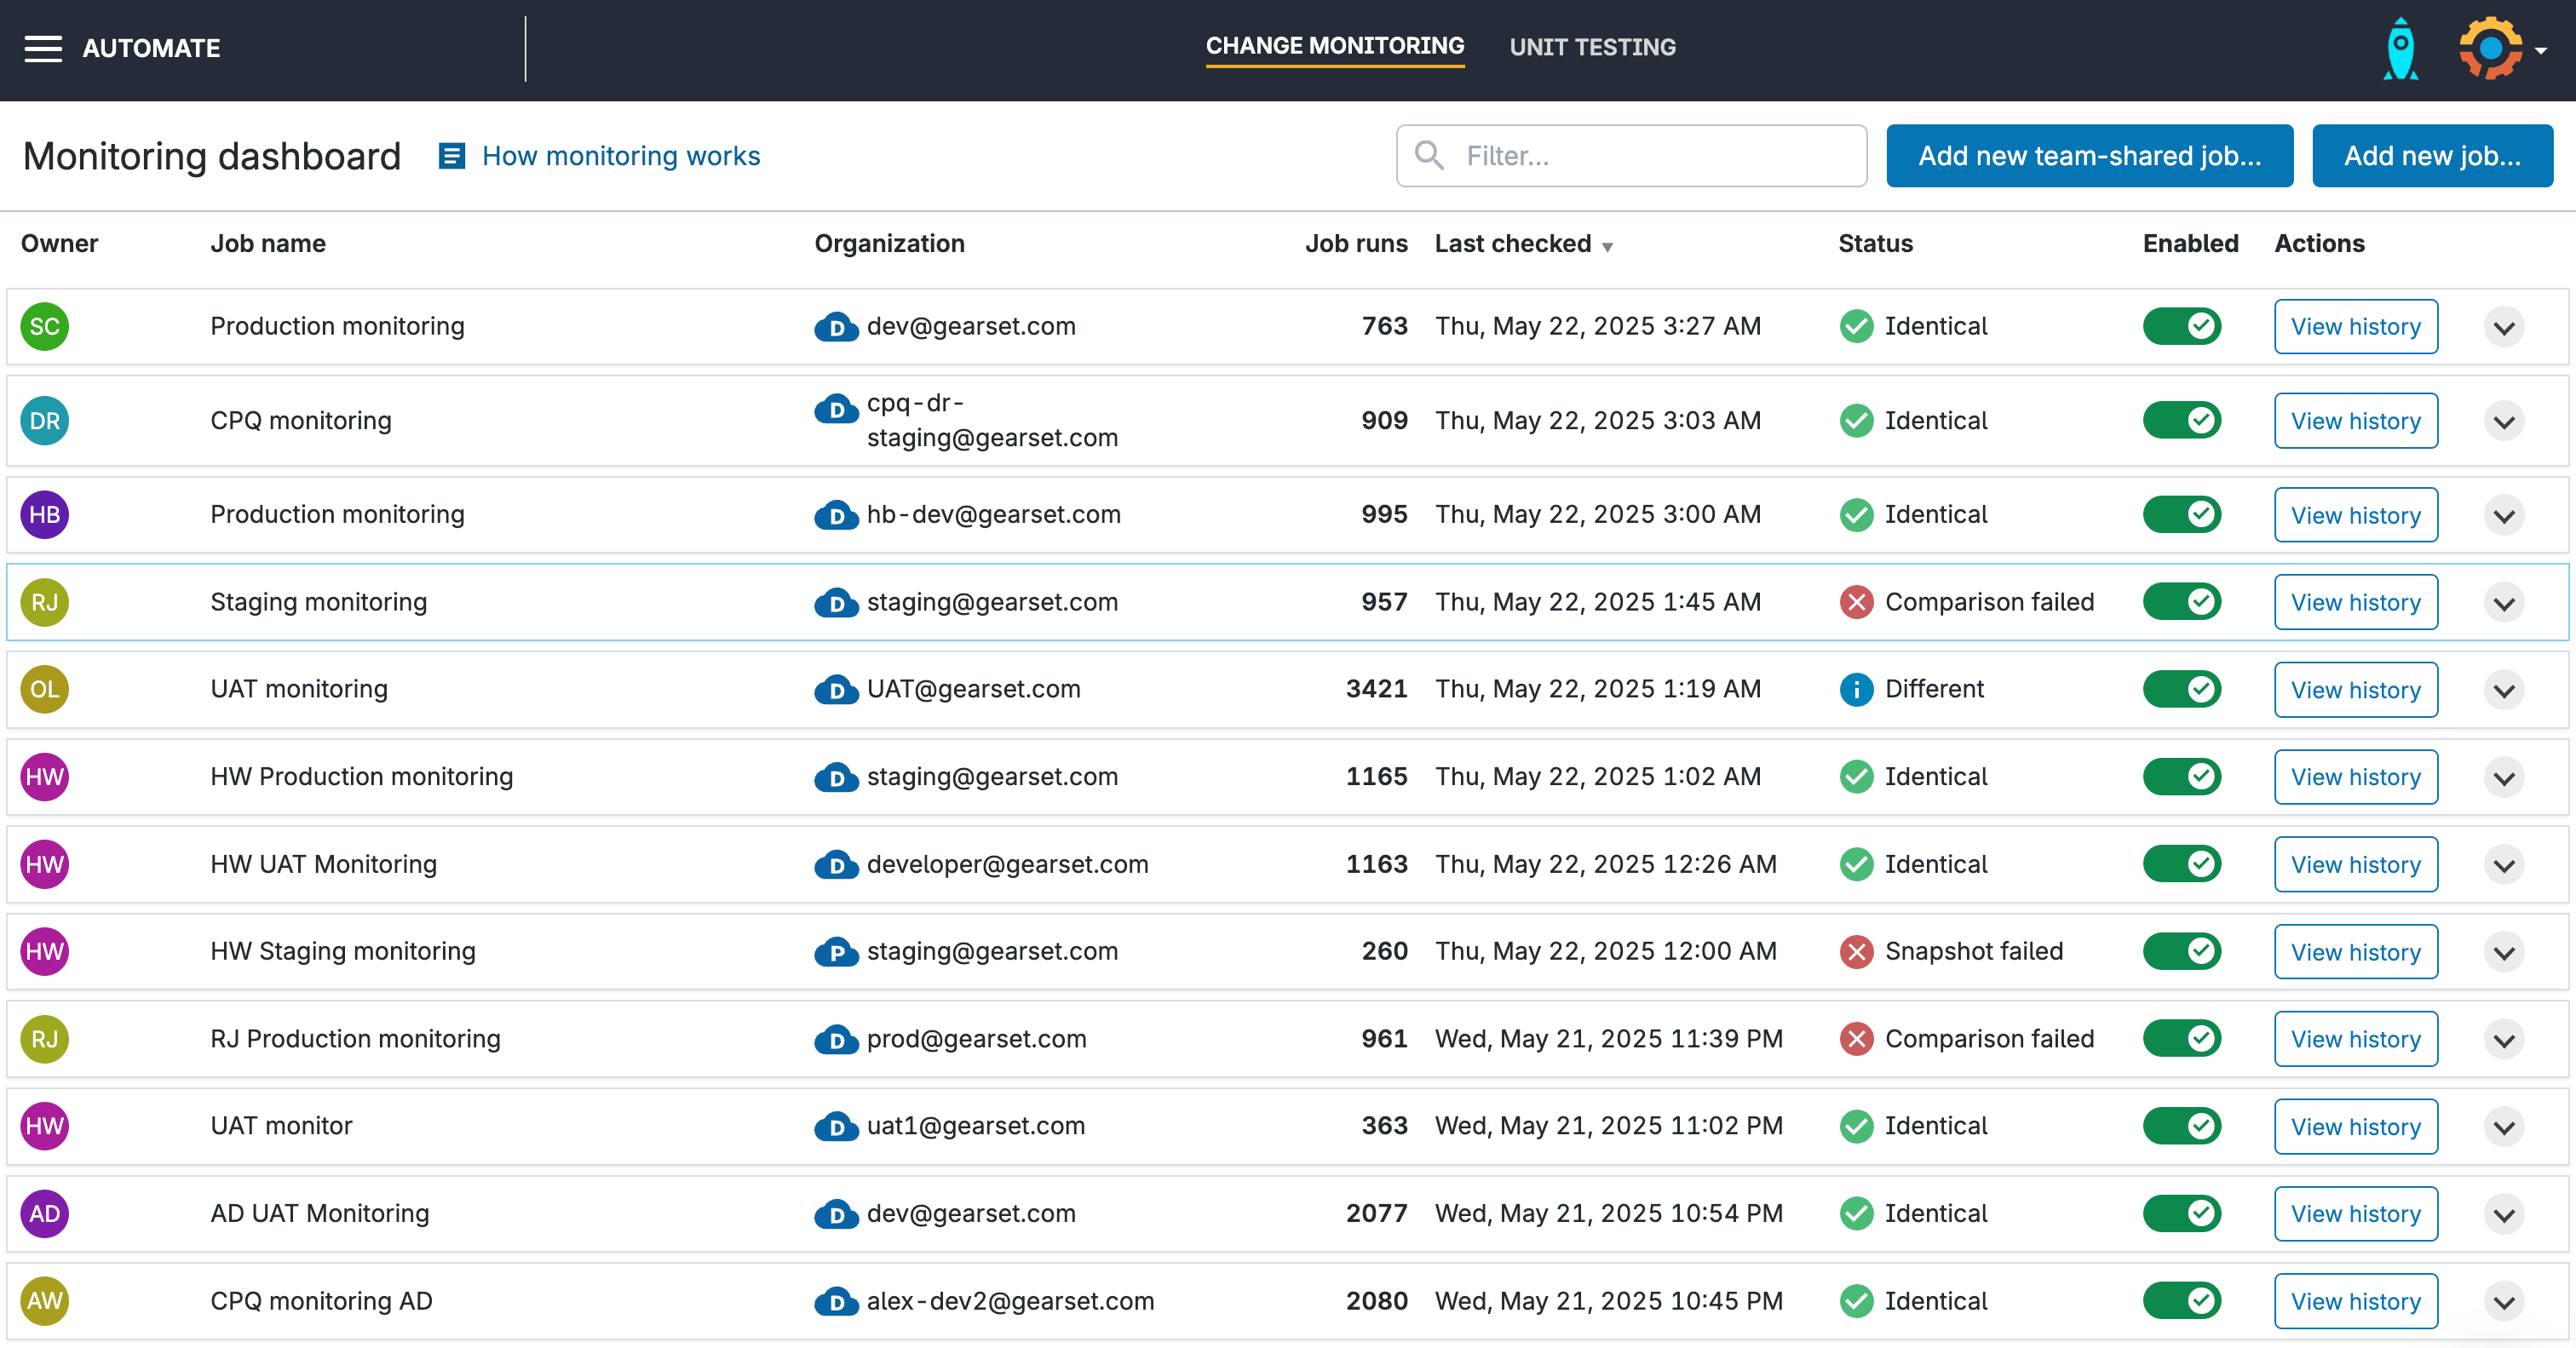
Metadata change monitoring
Change monitoring tools track configuration and code changes across environments. Tools like Gearset’s automated change monitoring highlight changes in real time through daily reports and configurable notifications, making it easier to link new issues to recent updates.
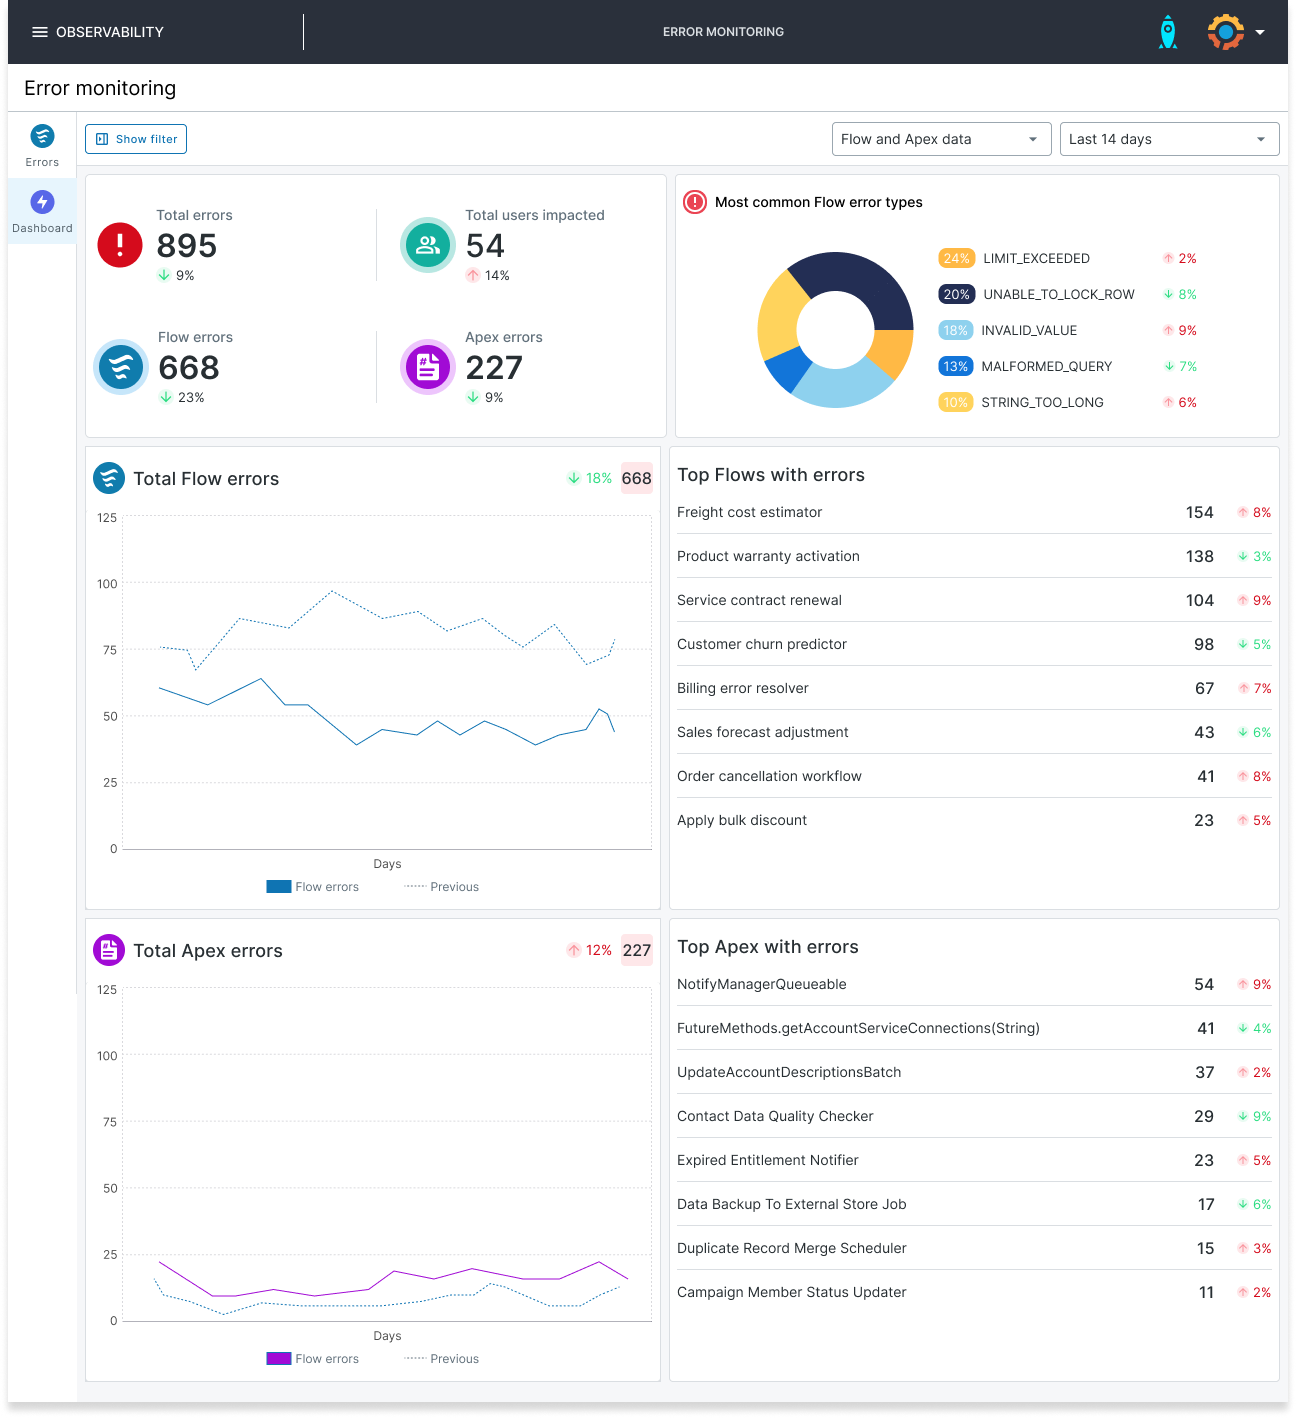
Gearset’s Flow and Apex monitoring give a centralized view of failures, integrate with Slack and Teams, and support custom notification rules so teams only get alerted about the errors that matter.
Event monitoring
Event monitoring in Salesforce gives you visibility into system-level activity such as logins, API calls, and Apex executions. Every org includes a limited free tier, but the data is delayed and covers only a handful of events. For teams that need broader coverage and instant visibility, Salesforce Shield Real-Time Event Monitoring unlocks a much larger catalog — from report exports to Flow executions — and delivers events as they happen.
Structured logging
Structured logging means embedding consistent log entries into Apex code and automations to capture what happens during a transaction. Unlike Salesforce’s raw debug output, these logs are recorded in a standard format so they can be stored, queried, and analyzed. Because Salesforce doesn’t offer this natively, teams either build their own logging framework or use third-party tools like Nebula Logger and Pharos.
These tools capture logs asynchronously with platform events or store them in custom objects, making them persistent beyond Salesforce’s normal limits, queryable with SOQL, and usable for downstream alerting, analysis, and reporting — either in Salesforce dashboards or external software development tools.
The Apex Log Analyzer (a VS Code extension from Certinia) offers a cleaner way to review downloaded debug logs and follow the flow of a transaction. It’s useful for individual debugging, but less suited for team-wide access because the logs are stored locally and shared manually.
Turning data into action: making the most of your insights
The value of embedding monitoring and observability tools throughout your DevOps pipeline isn’t just in data collection. You also need to know which metrics to track and how to respond. For Salesforce DevOps teams, some of the most useful metrics include:
- Deployment success rate: this tracks how often deployments succeed on the first attempt — highlighting issues with validation or dependencies.
- Mean time to resolution (MTTR): one of the core DORA metrics, the average time it takes to investigate and fix issues after detection.
- Flow and Apex error counts: how frequently automations or custom code fail, and whether error rates are rising or falling.
- API usage and limits: these metrics involve monitoring callouts to spot performance bottlenecks or risk of hitting governor limits.
- Test coverage and failure rates: identify if Apex tests run reliably and whether they are effective at enabling protection against regressions.
- User impact metrics: these show how issues affect end users directly, by tracking login errors, page load times, or failed transactions.
Once these metrics are visible in dashboards and fed into team channels, they become part of daily workflows. By reviewing them regularly, teams can prioritize fixes, spot recurring trends, and feedback into release processes — turning analytics into continuous improvement and making the whole DevOps lifecycle more efficient.
Challenges and pitfalls to watch out for
Left unmanaged, observability and monitoring can end up overwhelming teams with noise or become so fragmented that they add complexity instead of reducing it. Without thoughtful design and clear processes, they can end up obscuring the very problems they’re meant to reveal.
Alert fatigue
When every small fluctuation triggers a notification, important incidents get buried. Instead of chasing noise, align alerts with your release pipeline and existing tool stack so they flag what actually needs a response and surface where people will see them. This keeps the signal clear and helps the team act faster when something breaks.
Incomplete coverage
Debug logs or basic metrics leave you with critical blind spots. Instead, layer multiple approaches, like Flow and Apex error monitoring, change monitoring, and event monitoring, so you get a more rounded picture of what’s happening in your org.
Poor actionability
Collecting data is easy; turning it into action isn’t. If no one owns alerts or there’s no process to follow, issues sit unresolved. Building observability into your incident management means every alert has a clear owner, a documented path to resolution, and feedback that improves the next release.
Overcomplication
Stacking too many tools or dashboards creates silos and confusion instead of clarity so teams should consolidate where possible. One integrated DevOps solution is better than stitching together multiple tools that don’t talk to each other. Choose tools that integrate cleanly so you’re not navigating multiple files, dashboards, and systems that reduce overall efficiency.
Cultural gaps
If observability is seen as just monitoring for the operations team, its impact is limited. Make observability a key part of how the whole team works — not just admins but also developers, testers, and business stakeholders — ensuring the practice scales across distributed teams and improves overall capability.
Put observability and monitoring into action
Strong monitoring and observability practices can transform your team’s ability to deliver on Salesforce. According to the State of Salesforce DevOps 2025 report, teams with an observability solution are 50% more likely to catch bugs within a day and 48% more likely to fix them within a day. That’s the difference between firefighting and moving fast with confidence.
To see how Gearset can help your team today, explore our Flow and Apex error monitoring solution. And dive deeper into building an observability strategy by downloading our free Salesforce Observability whitepaper.
