

Adopting DevOps will enhance release quality and security for any team, and a crucial part of that is being confident that you’re releasing reliable code that’s well-tested and secure. Static code analysis helps you improve code quality and prevent vulnerabilities or even complete outages. Unfortunately, this type of testing is too often seen as an afterthought, with teams waiting until the late in the DevOps lifecycle to check their code.
By adding static code analysis into your DevOps release process at the earliest opportunity, you’re able to deeply understand your code from the moment it’s written, identify potential bugs and rectify any security vulnerabilities — while it’s quick and painless to fix.
Gearset acquires Clayton
Supporting more of the DevOps lifecycle is part of the reason Gearset acquired static code analysis tool Clayton in September 2024. This integration will strengthen Gearset’s code analysis, offering a comprehensive testing suite to customers who are serious about identifying vulnerabilities and tracking code quality over time.
With Clayton from Gearset, you get best-in-class static analysis for Salesforce code and configuration, helping you catch and fix issues without needing to dedicate hours of precious development time.
In this post we’ll look at what static code analysis is, why it’s important and how you can scan your code for bugs and vulnerabilities using Clayton from Gearset.
Standardizing Salesforce delivery in Manufacturing: Lessons from a release team
What is static code analysis?
Static code analysis for Salesforce is the process of scanning your Apex code for errors, security vulnerabilities and bugs without actually executing the code. It detects any low-quality code and makes sure your code is performing as well as possible. It also encourages the whole team to write clean and consistent code that can be changed more easily later on. This static code analysis improves observability, allowing for a more proactive approach to identifying and addressing problems before they impact production.
Most static code analysis tools allow you to customize a ruleset. Rules tend to fall into one of the following categories:
- Best practices
- Coding styles
- Design
- Performance
- Security
Rulesets can be tweaked and maintained to find the right balance between warnings and serious errors.
How is static code analysis different from unit testing?
Static code analysis and unit testing are both important in the development lifecycle, but they serve different purposes. Unit testing actually executes the code you’re testing. It’s not checking for vulnerabilities, and instead is used to check whether your code is being executed as you’d expect. It’s a strict requirement by Salesforce that your Apex code has a code coverage of 75% before it can be deployed to your production org.
Advantages of static code analysis
Embedding static code analysis in the DevOps lifecycle brings a whole range of benefits:
Early detection of code issues and anti-patterns
Coding issues or anti-patterns can seriously degrade the performance of your Salesforce environments. Anti-patterns, especially, can lead to huge technical debt and inefficiency so identifying them earlier saves time and effort. This early testing approach, called “shifting left”, moves your testing processes to the earliest stages of development and releases, so you can catch issues while they cost the least time and effort to fix.
Reduced cost, time and resources
By catching bugs and vulnerabilities early, you minimize the need for long hours of debugging late in the development process — saving the business money and the whole development team a lot of precious time and resources.
Enhanced code consistency
Agreeing on a code analysis ruleset encourages uniform coding styles and consistency throughout the whole team. Code consistency makes it easier for teammate’s to read, review, and refactor each other’s code. The quality of the code also makes onboarding new team members as easy as possible, allowing them to get up to speed more quickly.
Improved security
Static Application Security Testing (SAST) is the same as static code analysis, but it looks specifically at security vulnerabilities like SQL injection, cross-site scripting (XSS), and insecure coding patterns to prevent any security risks. Identifying vulnerabilities before they are anywhere near your production environment keeps everything in your org as secure as possible.
Static code analysis best practices
There are a number of best practices to remember and key mistakes to avoid when considering how static code analysis helps your DevOps strategy.
Include static code analysis throughout your pipeline
Including code analysis at multiple stages in your development process will give you the best defense against bugs and errors making their way to your production environment. By checking often you’re able to keep on top of any errors as they come up.
Integrate code analysis with CI/CD
Automating and incorporating static code analysis into a CI/CD pipeline streamlines spotting and resolving issues as soon as they’re detected.
Customize analysis rules
Writing your own custom analysis rules allow you to tailor the whole testing process exactly to your team. Fine tuning these rules can reduce the number of false positives you’re alerted to. This can be because of an overly strict rule, or a misunderstanding by the tool of the overall context. False positives can waste a lot of time, when there’s no actual problem.
Enforce code standards
Once you’ve agreed on a set of rules as a team, you can decide whether infractions should trigger warnings that need to be checked or errors that must be fixed before promoting changes. Enforcing these strict rules means substandard work is held back by quality gates in the pipeline and must be checked. Teams will likely want to come back at a later date to add or modify the rules.
It’s important to implement code standards into your static code analysis rules. With consistent and clear coding styles, developers can spot and rectify mistakes much faster.
The limitations of PMD for Salesforce static code analysis
PMD is a static analysis tool for multiple languages that includes support for Apex and Visualforce. Because it’s community maintained, PMD is updated frequently and has some pre-built rulesets ready for developers to get started quickly.
PMD is free and is included in Salesforce’s Code Analyzer toolset, meaning developers can get started quickly. But alongside these benefits, there are some limitations.
Limited customizations: Limited rulesets and a lack of customizations can lead to blind spots in your org.
False positives and negatives: A lot of noise from the analysis means that actual errors you care about are overlooked and other ones are flagged as errors when they aren’t important. This causes bugs to slip through the next, and wastes time digging into an issue that doesn’t exist.
A lack of security: While PMD catches some security vulnerabilities, it doesn’t have the detection capabilities of a third-party tool. For instance, PMD works by identifying patterns which means that it’s possible a developer uses a pattern that PMD does not take into account.
No reporting or tracking: Reporting capabilities are more basic with a lack of tracking for code quality over time. There’s no way to visualize any improvements or regressions over a specified time period. That said, tracking might be possible, but only if your third-party tool has a way to visualize your code analysis.
Lack of support for enterprise: PMD starts to fall over when faced with a large codebase. It becomes slow and unresponsive if faced with too many rulesets and lacks support for more complex customizations.
While PMD is a powerful tool for static code analysis, it only really comes into its own on smaller projects, or for developers with simpler customizations. For more targeted testing, with enhanced security reviews, enterprise support and user-friendly features you’ll need to look for a third-party tool.
Static code analysis with Clayton from Gearset
With Clayton from Gearset, you’ll deliver high-quality, bug-free and secure code at speed. As it’s integrated into your release pipeline, Clayton catches bugs and vulnerabilities far earlier in your development cycle. What’s also great is that Clayton doesn’t just scan Apex — you can scan medatadata like flows and layouts for errors too. Let’s walk through Clayton for Gearset.
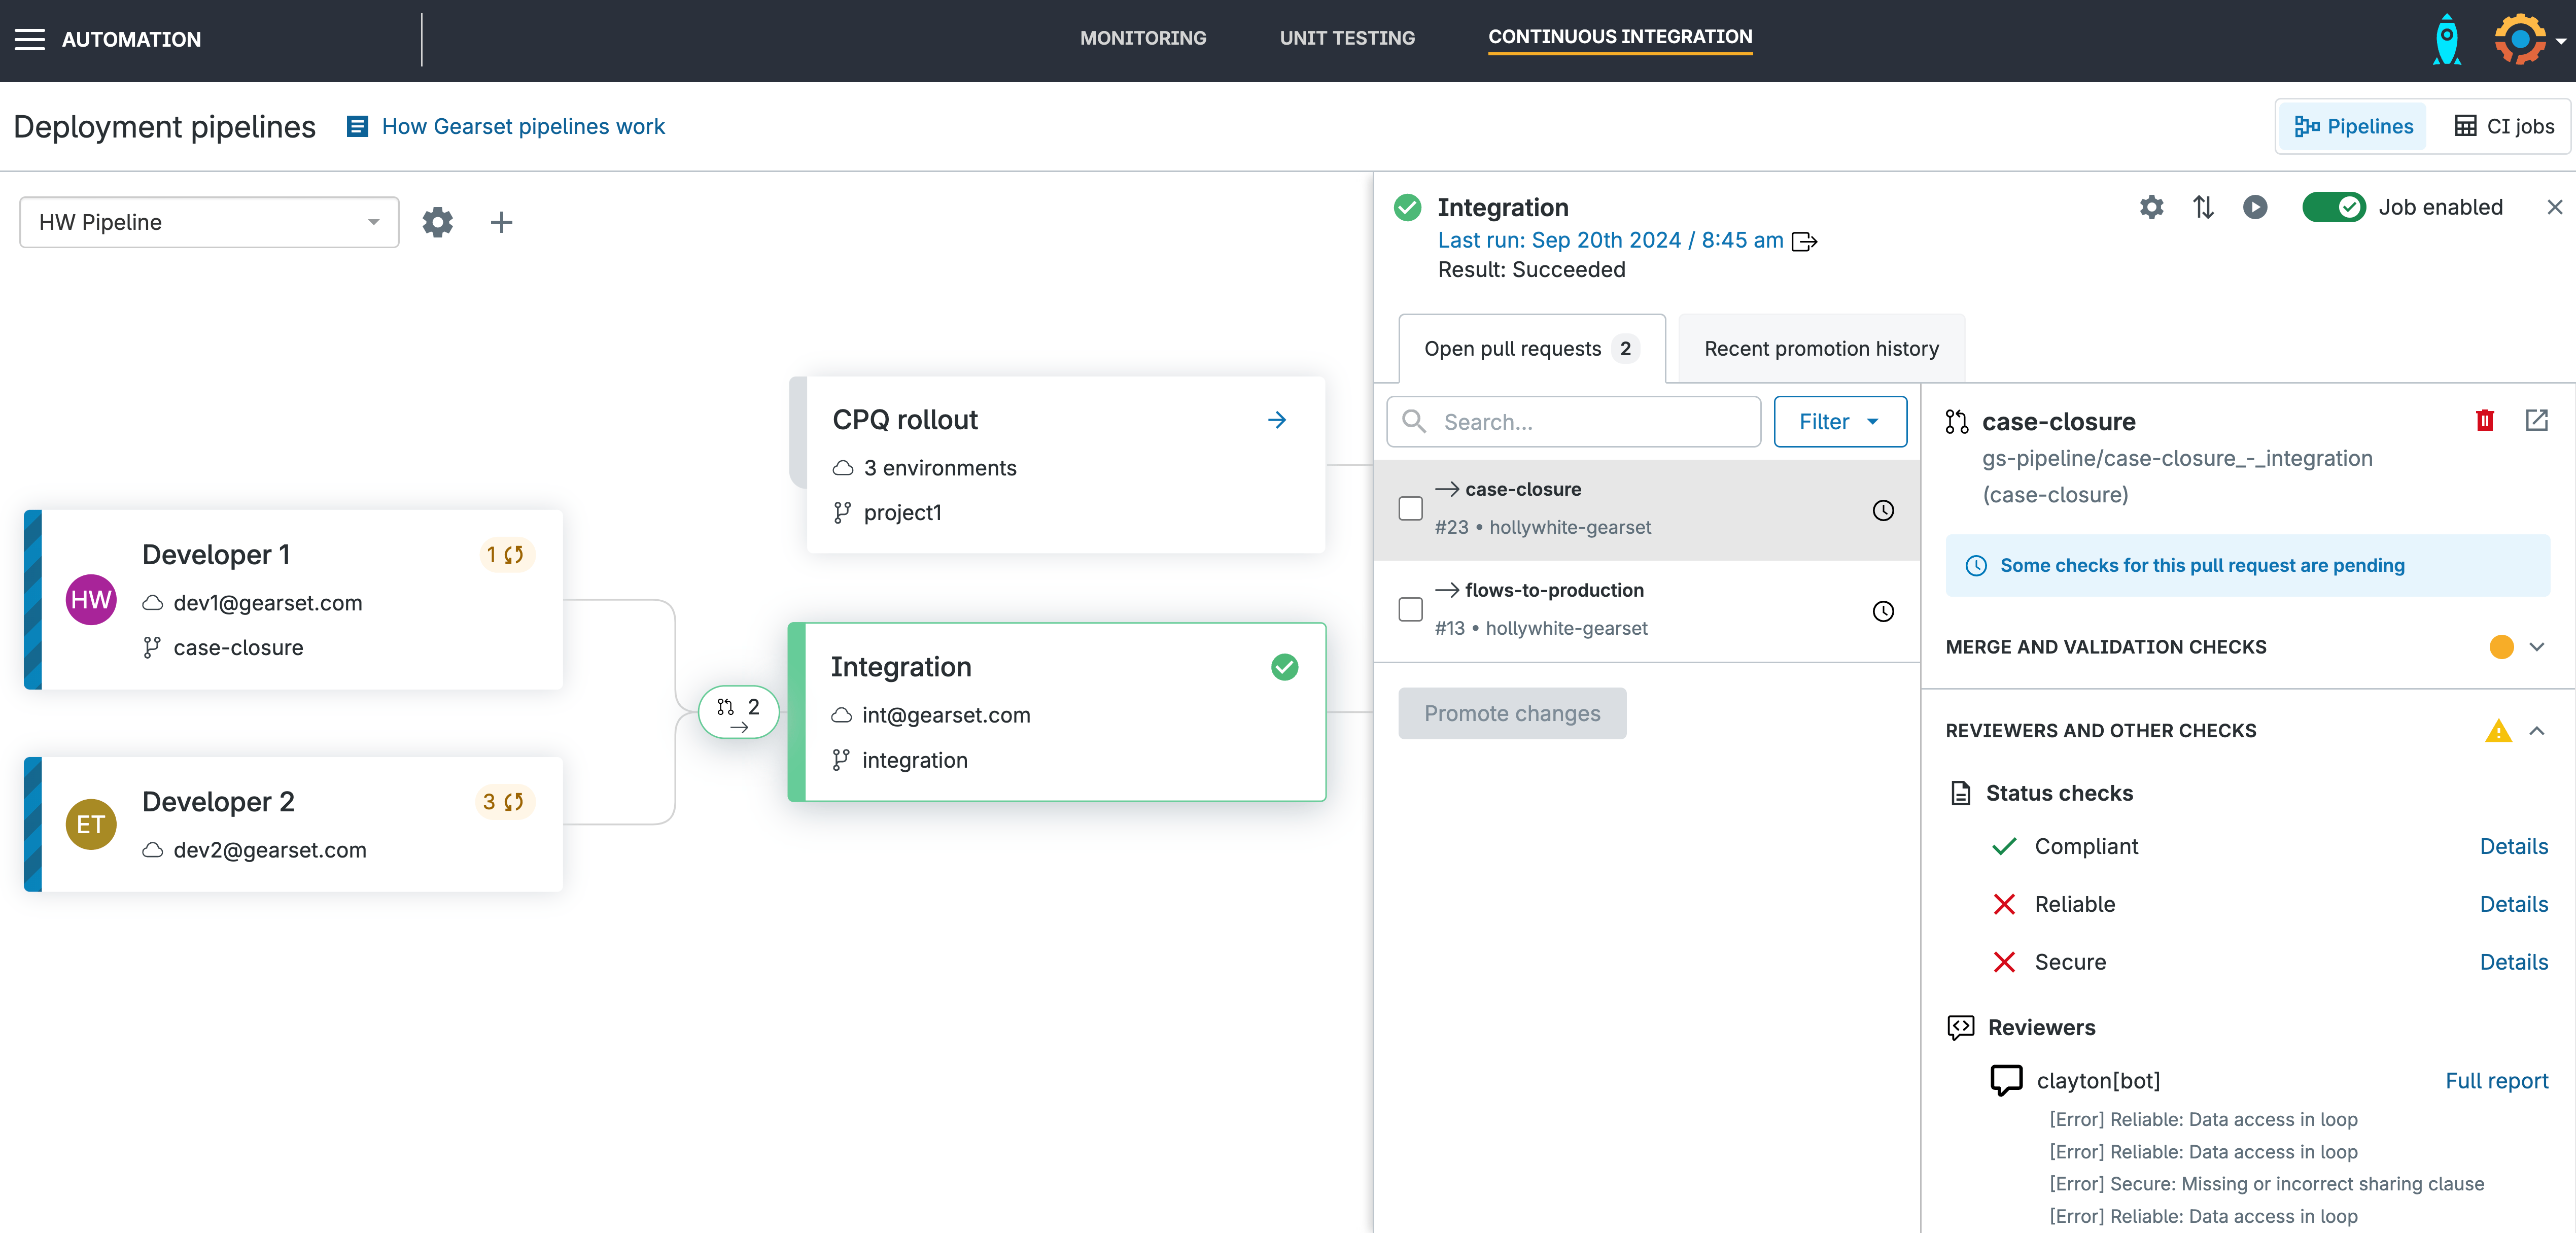
Open your pull request in Gearset’s Pipelines
When you open a pull request in Gearset, the Clayton scan will run and the results are presented as status checks when you click into your environment. If your code has any security vulnerabilities, Clayton will block it from being promoted.
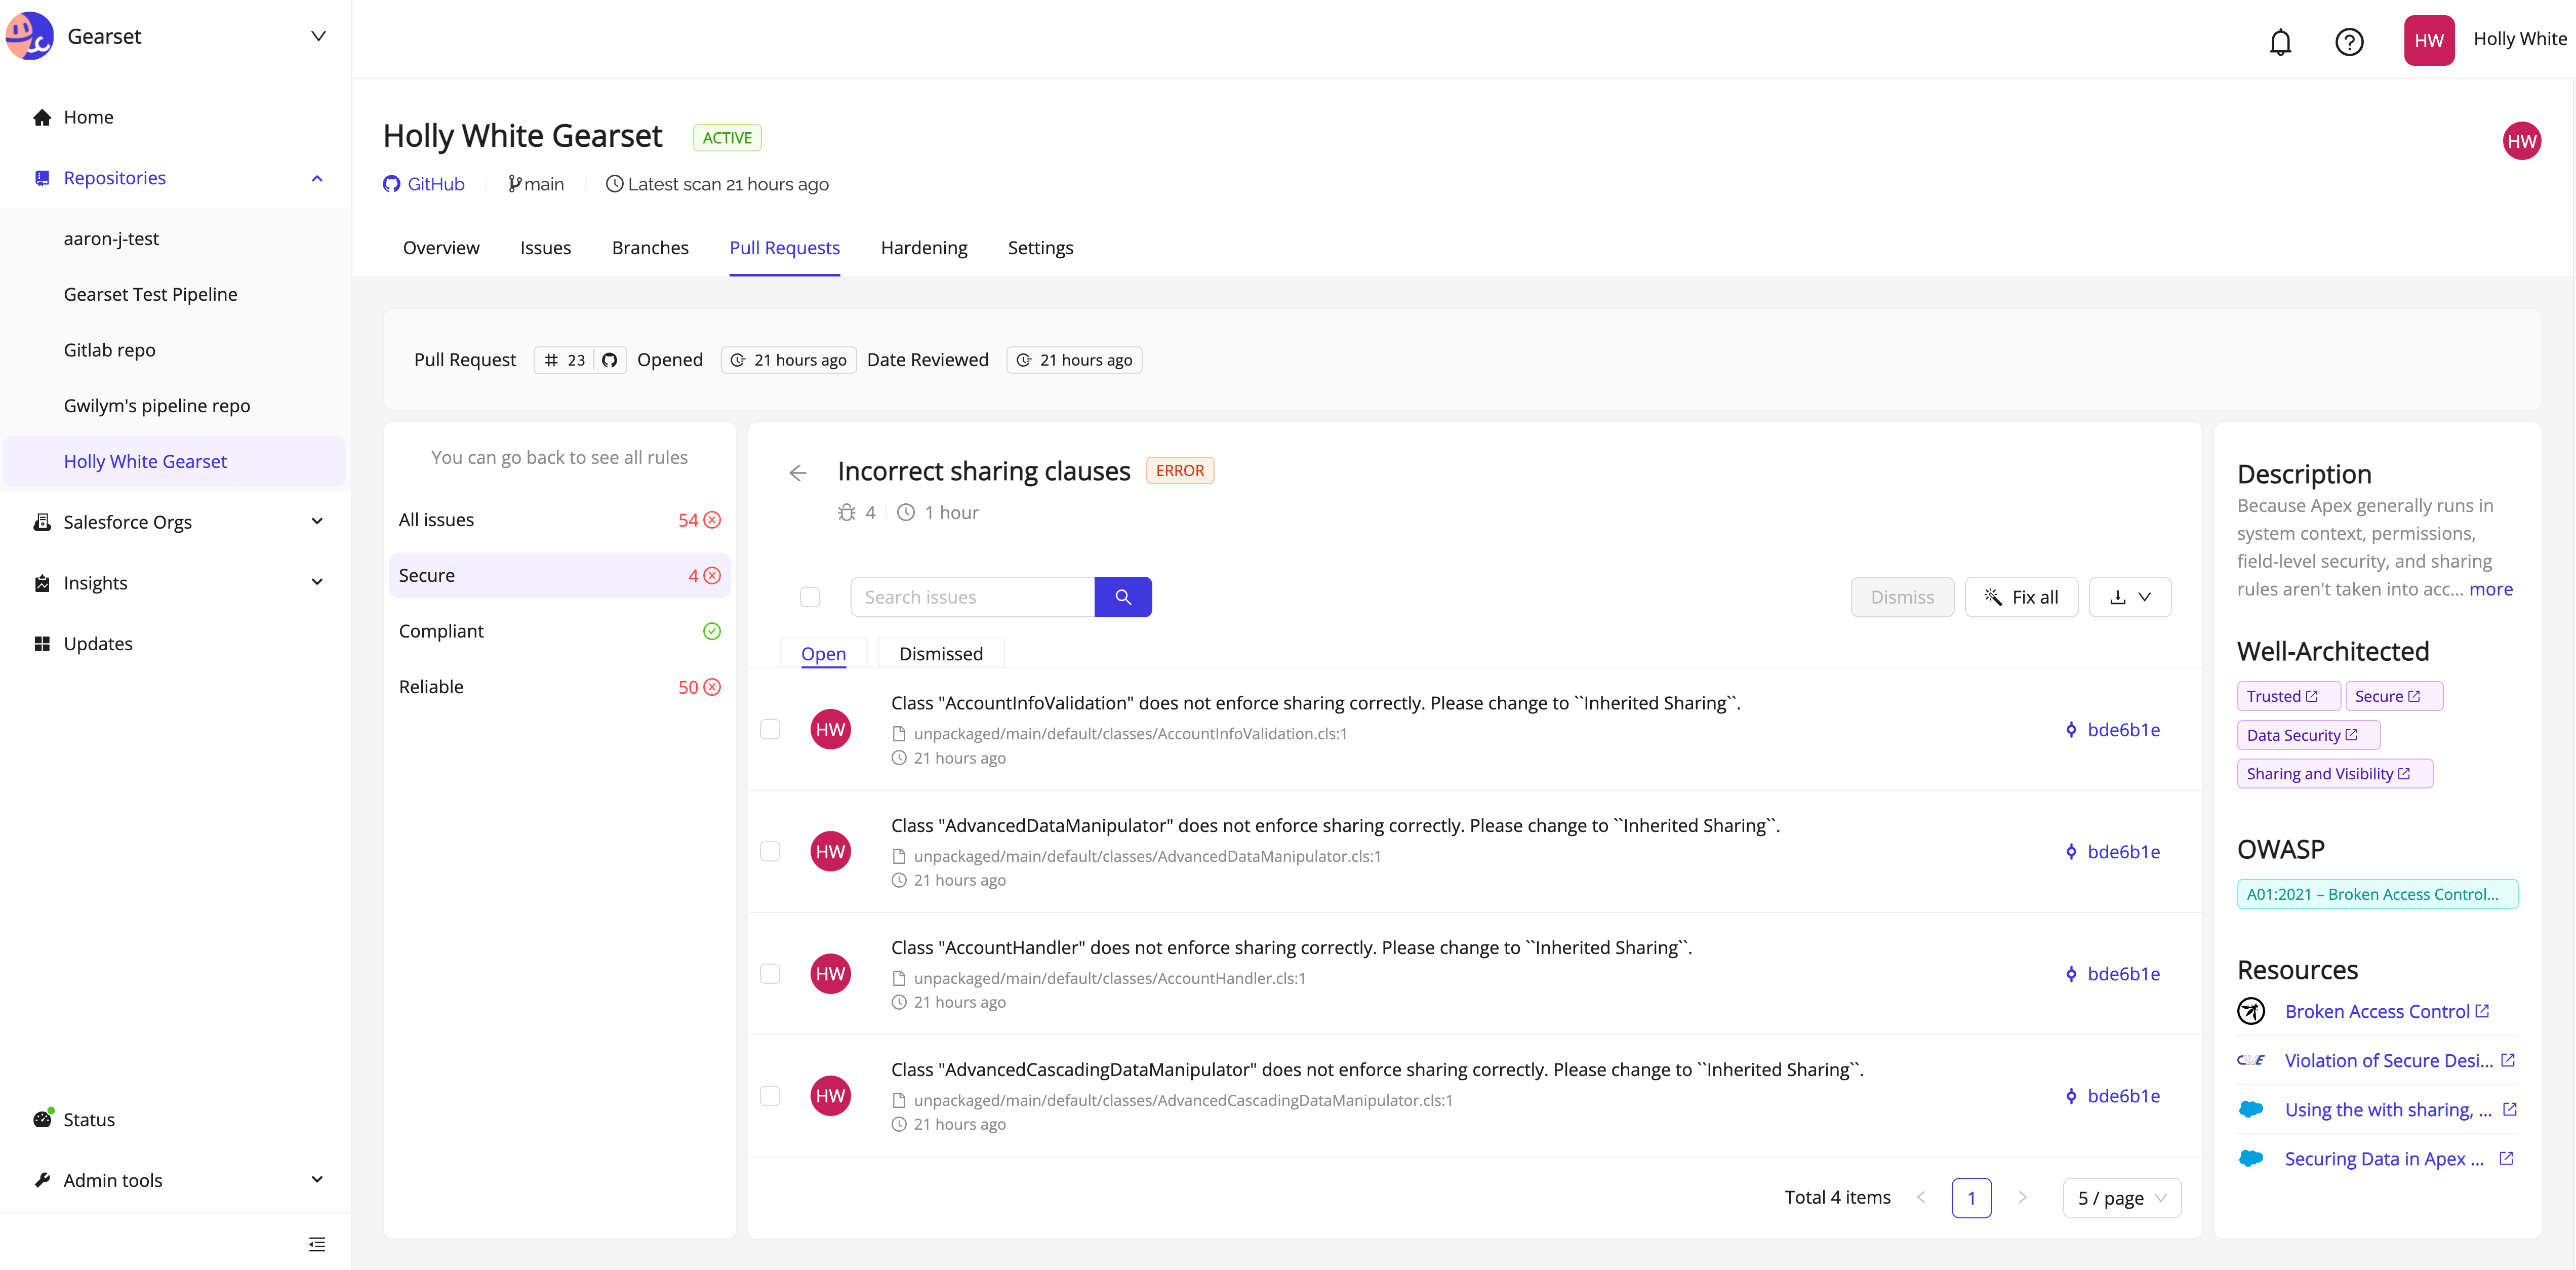
Review your insecure code
After clicking Details you’ll be taken to your Clayton report which will list the errors detected in your code. You’ll be given the option to fix the issue (using an autofix if one is offered) or to dismiss the warning as a false positive.
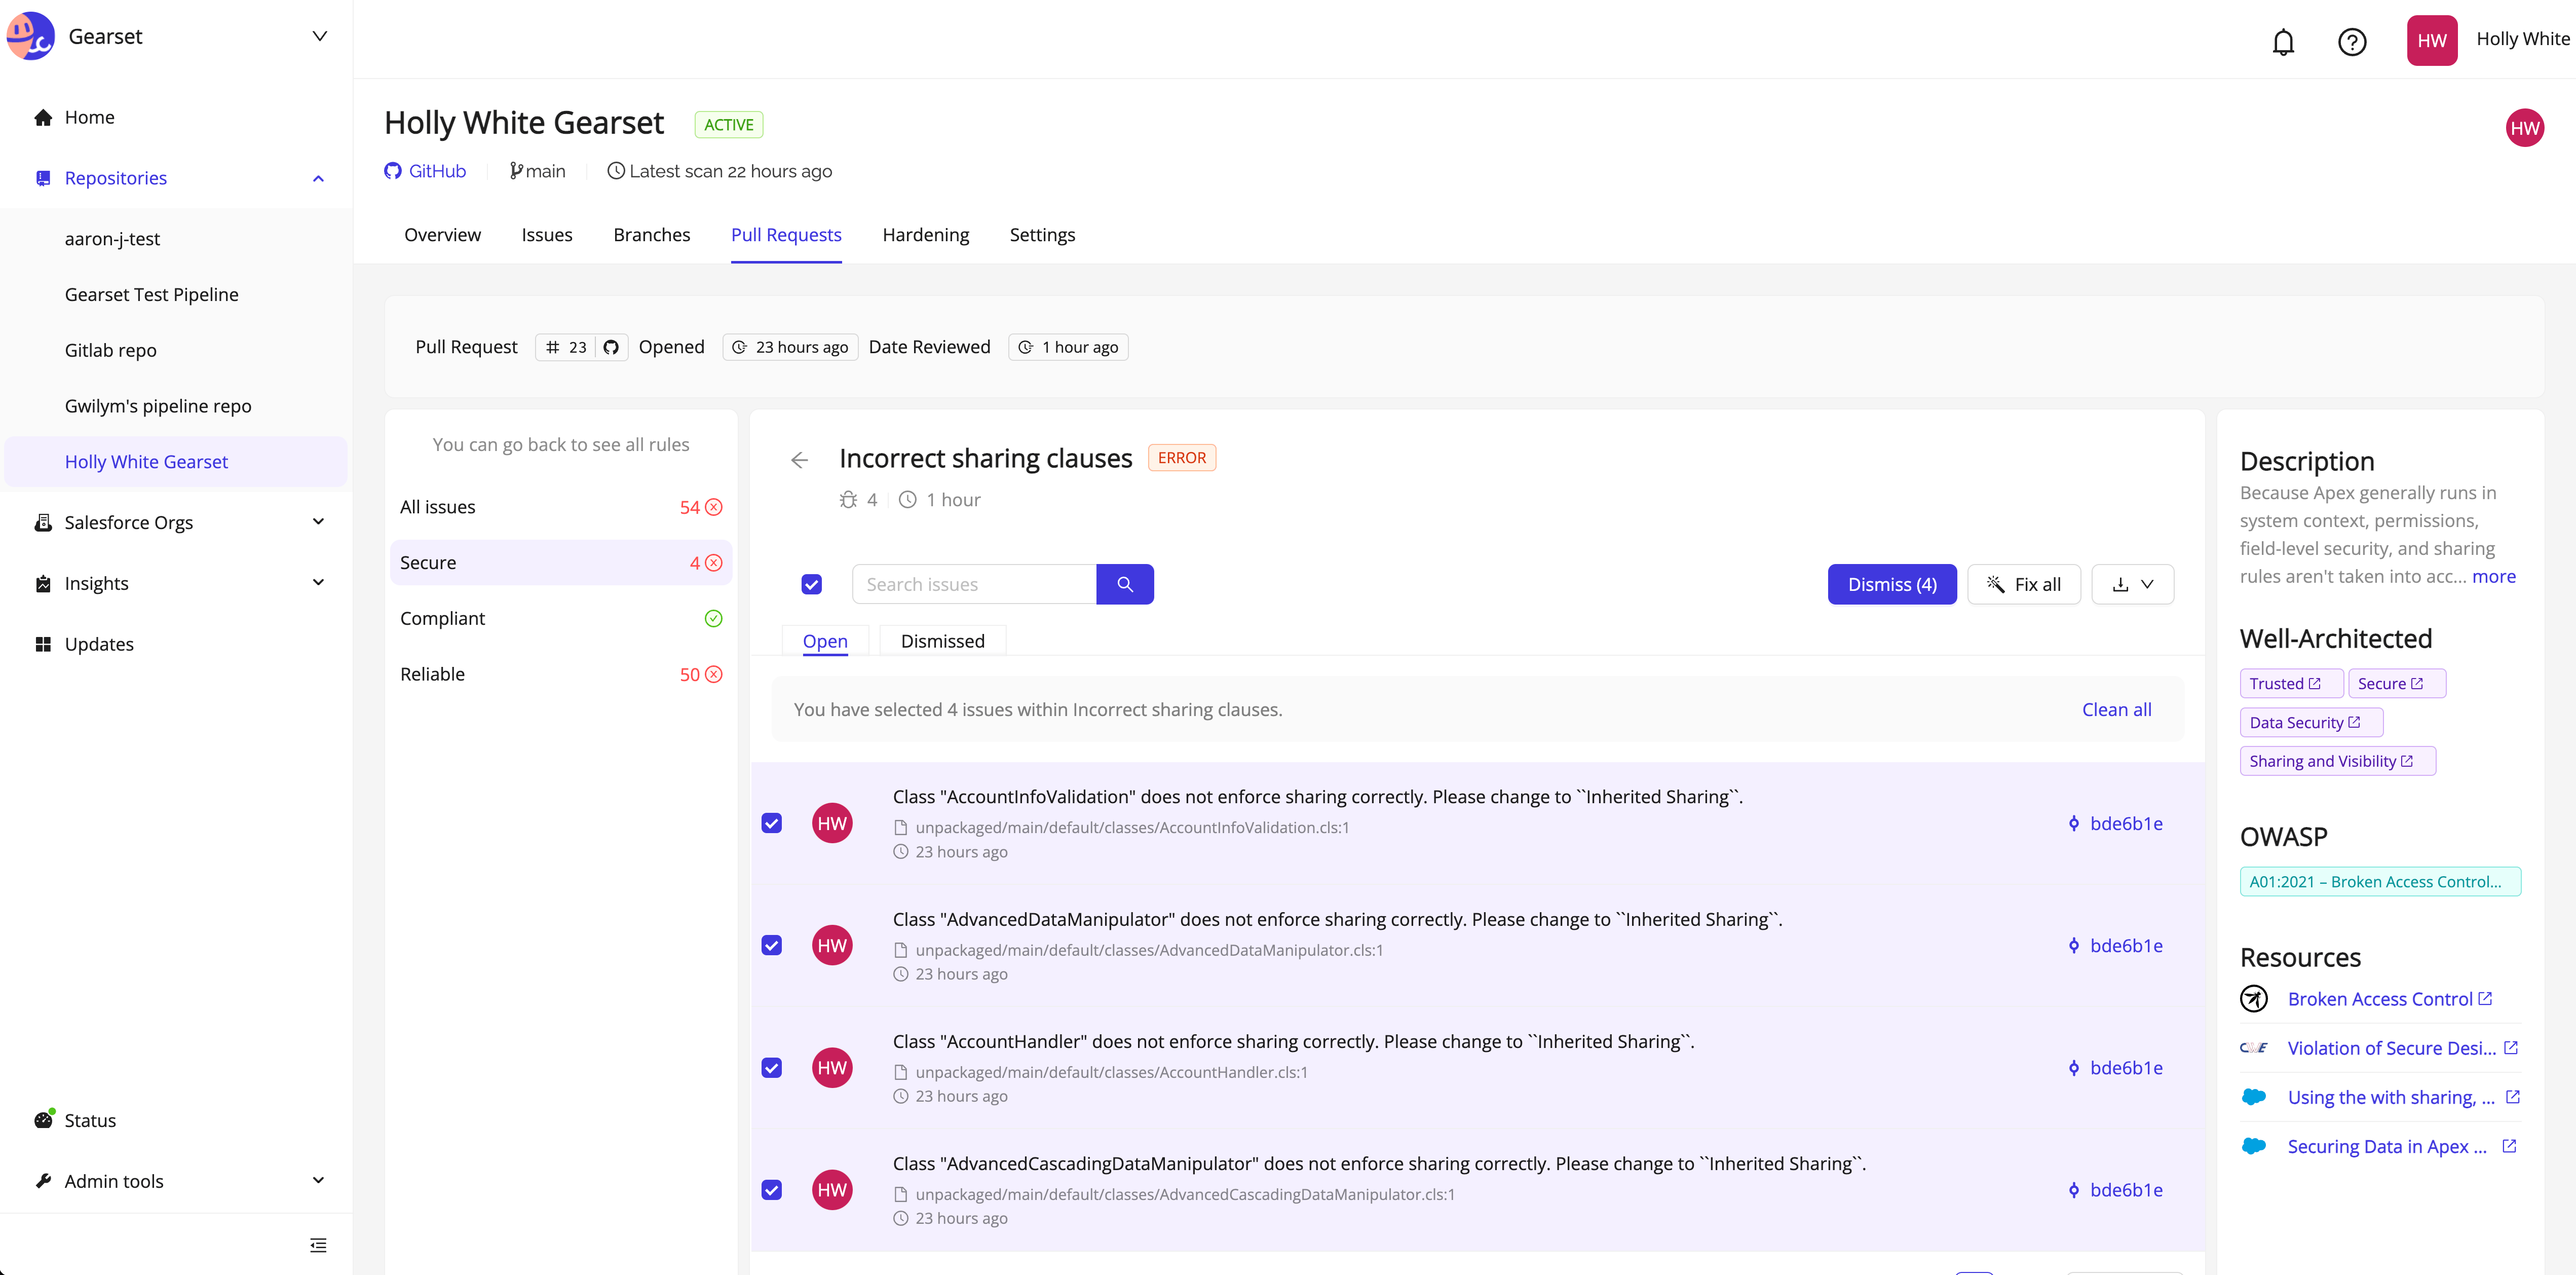
Fix your coding issues
In this example, all of our security vulnerabilities can be fixed with Clayton’s autofix tool. Select all, then click Fix all. Clayton will create a PR for the fixes, which will then automatically appear in your Gearset developer sandbox.
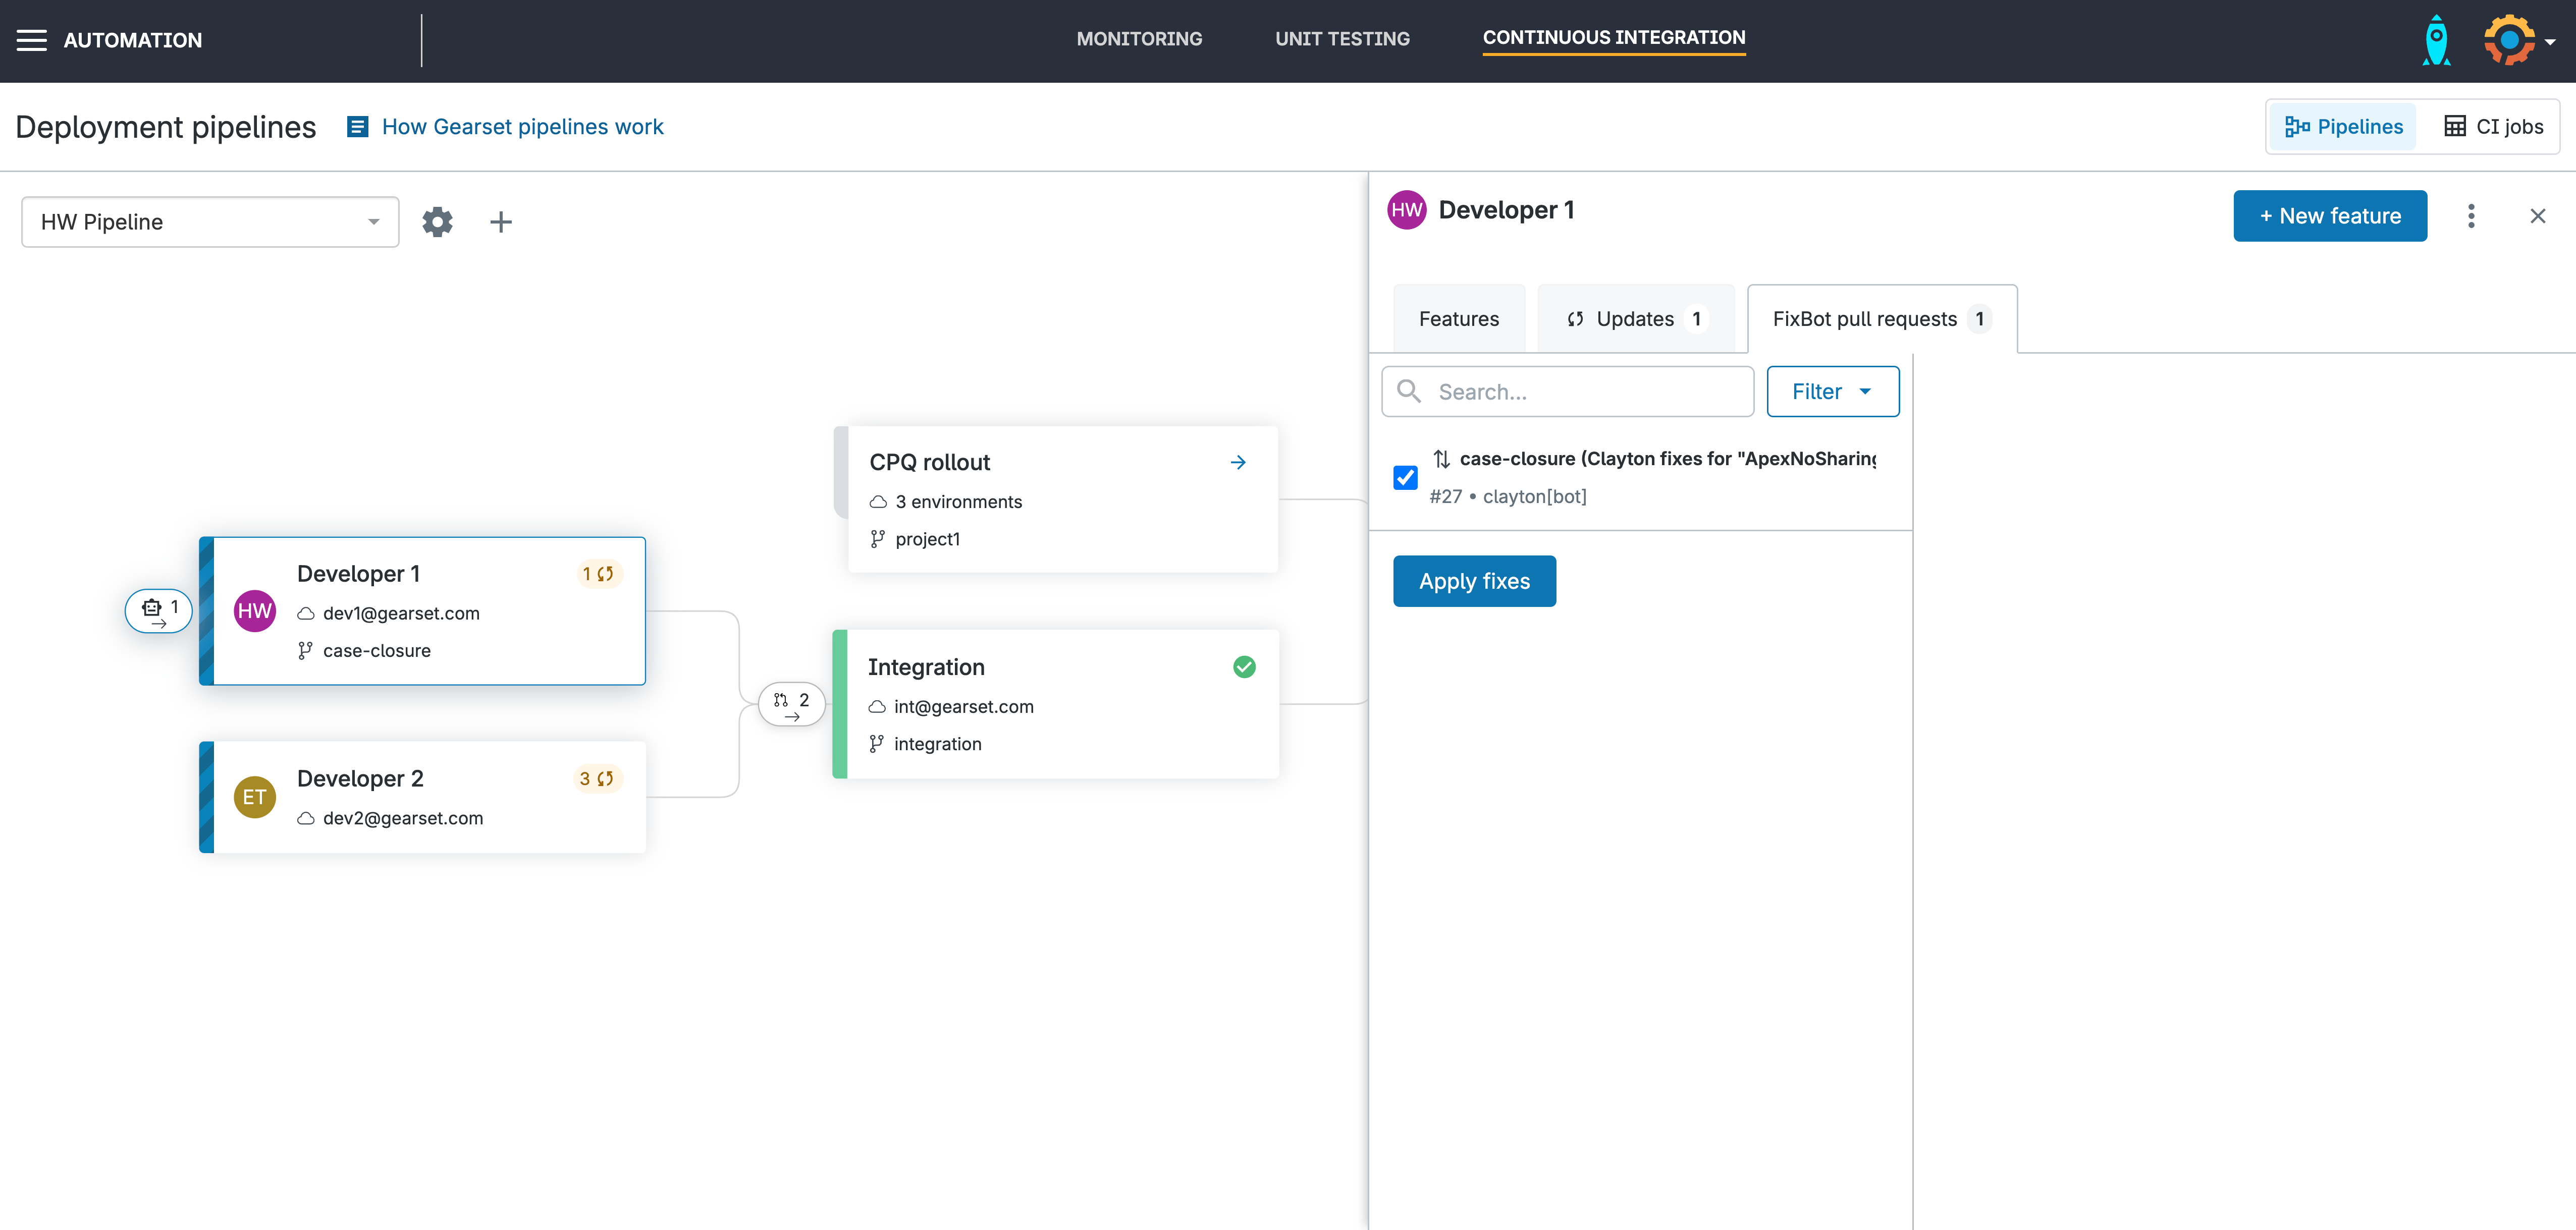
Apply the fixes in Gearset
You’ll see the Clayton robot icon appear with your changes ready to be applied to your sandbox. Select the PR, and then click Apply fixes. This will trigger the status checks to re-run on the original pull request.
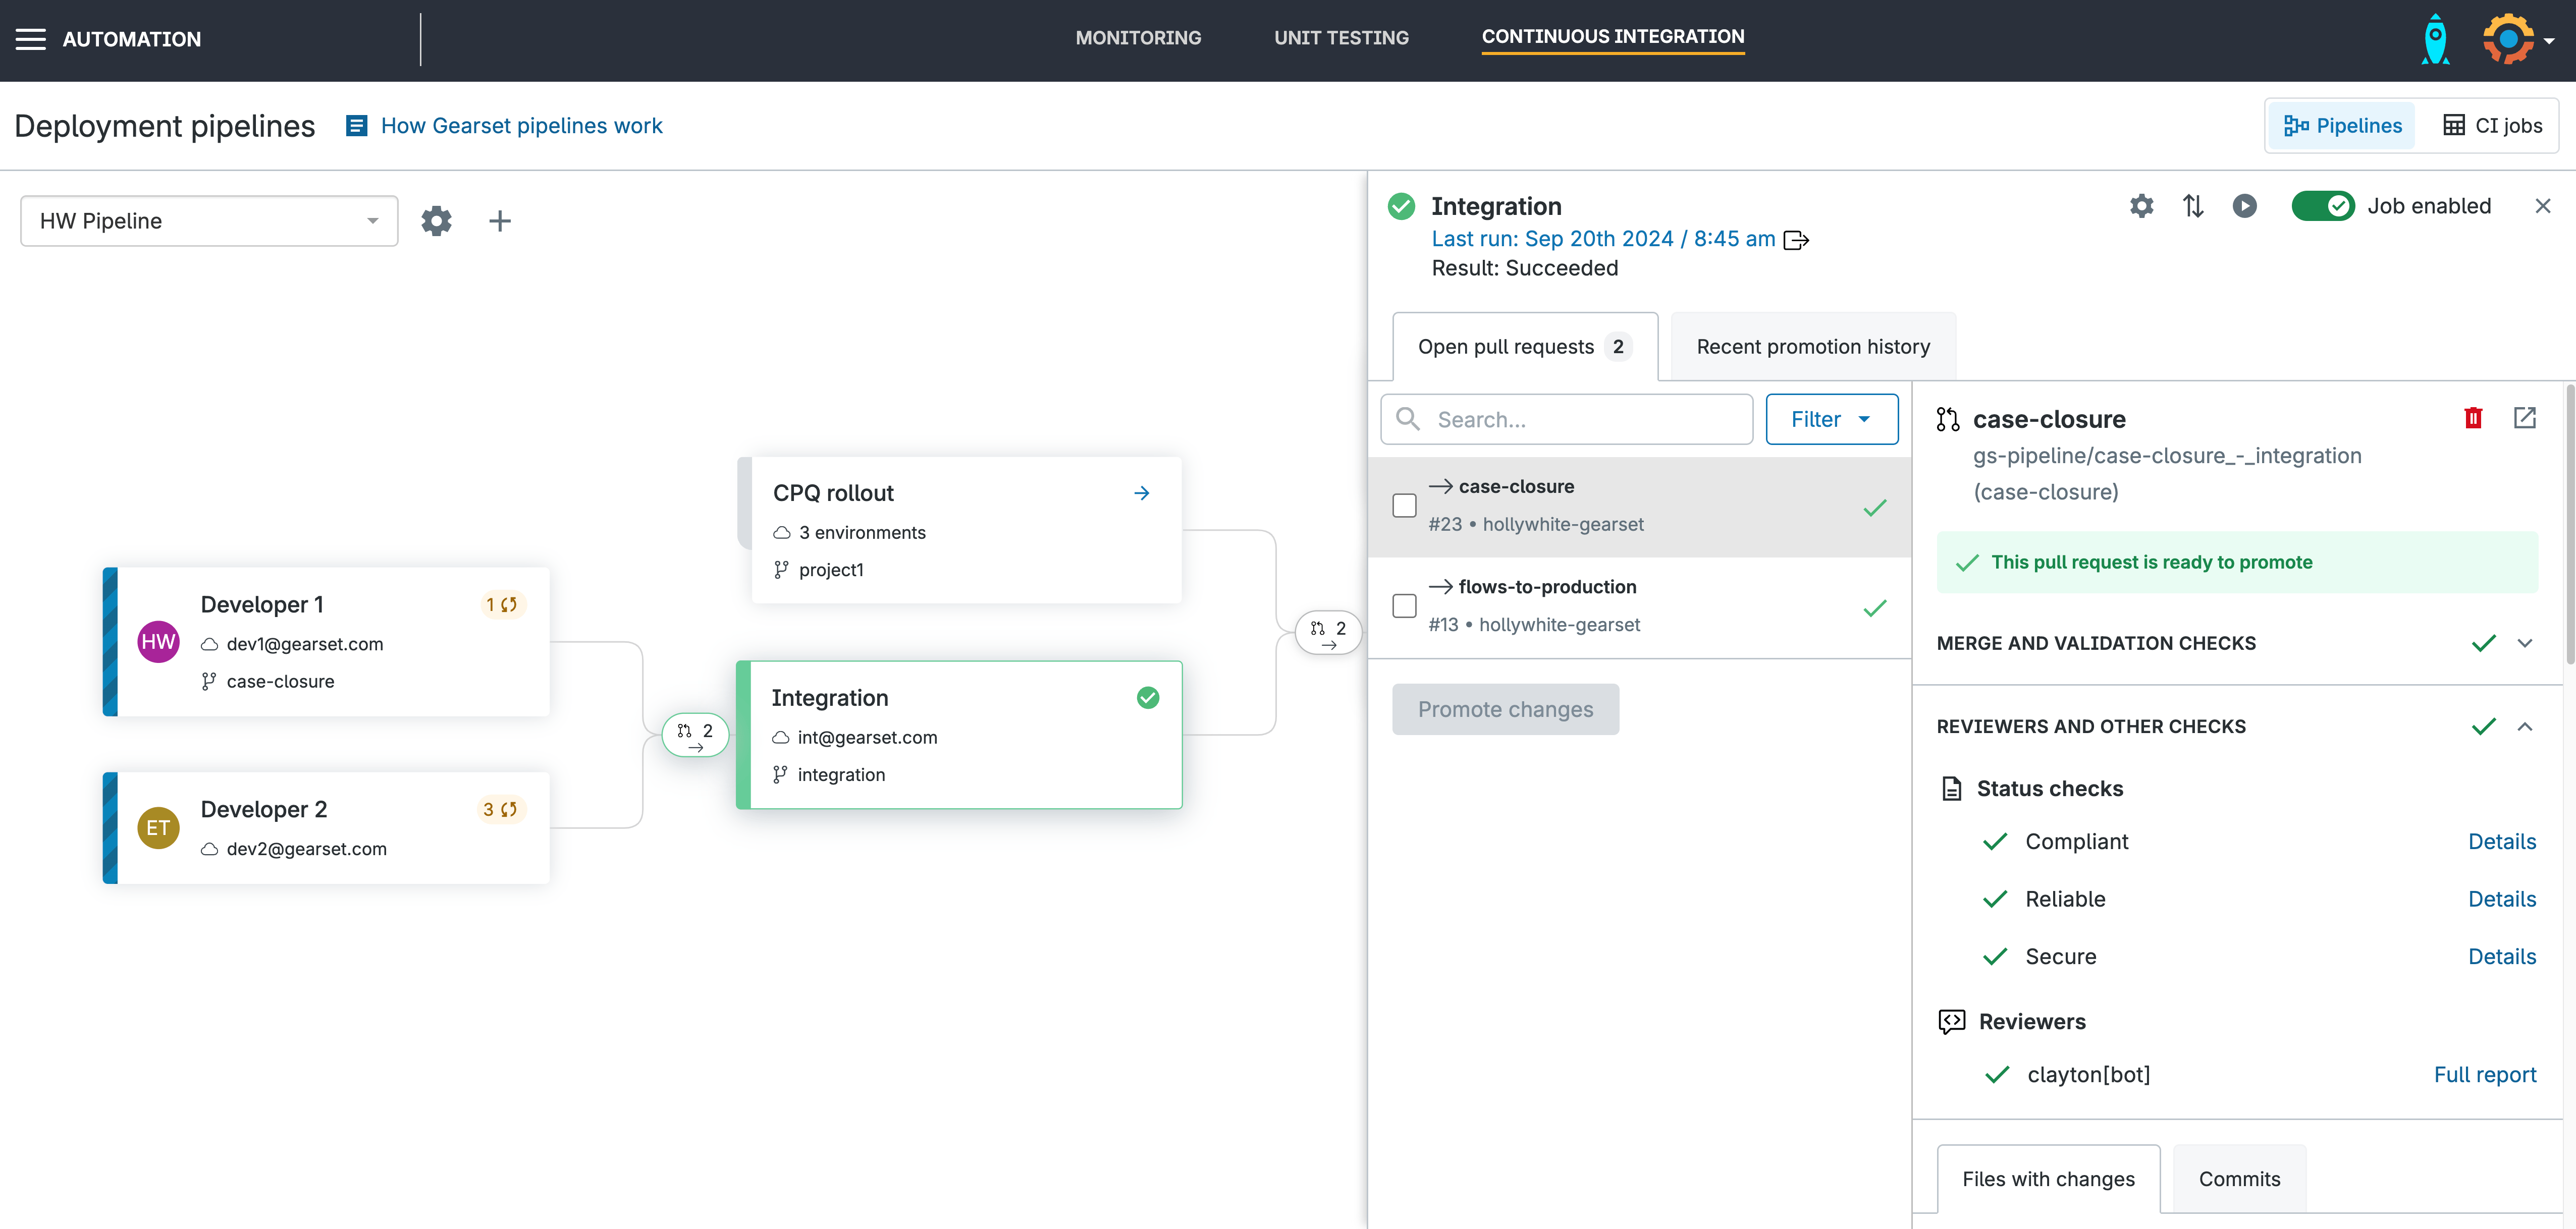
Promote your PR
Your PR is now available to be promoted with all fixes applied!
Save hours on bug fixes for Salesforce
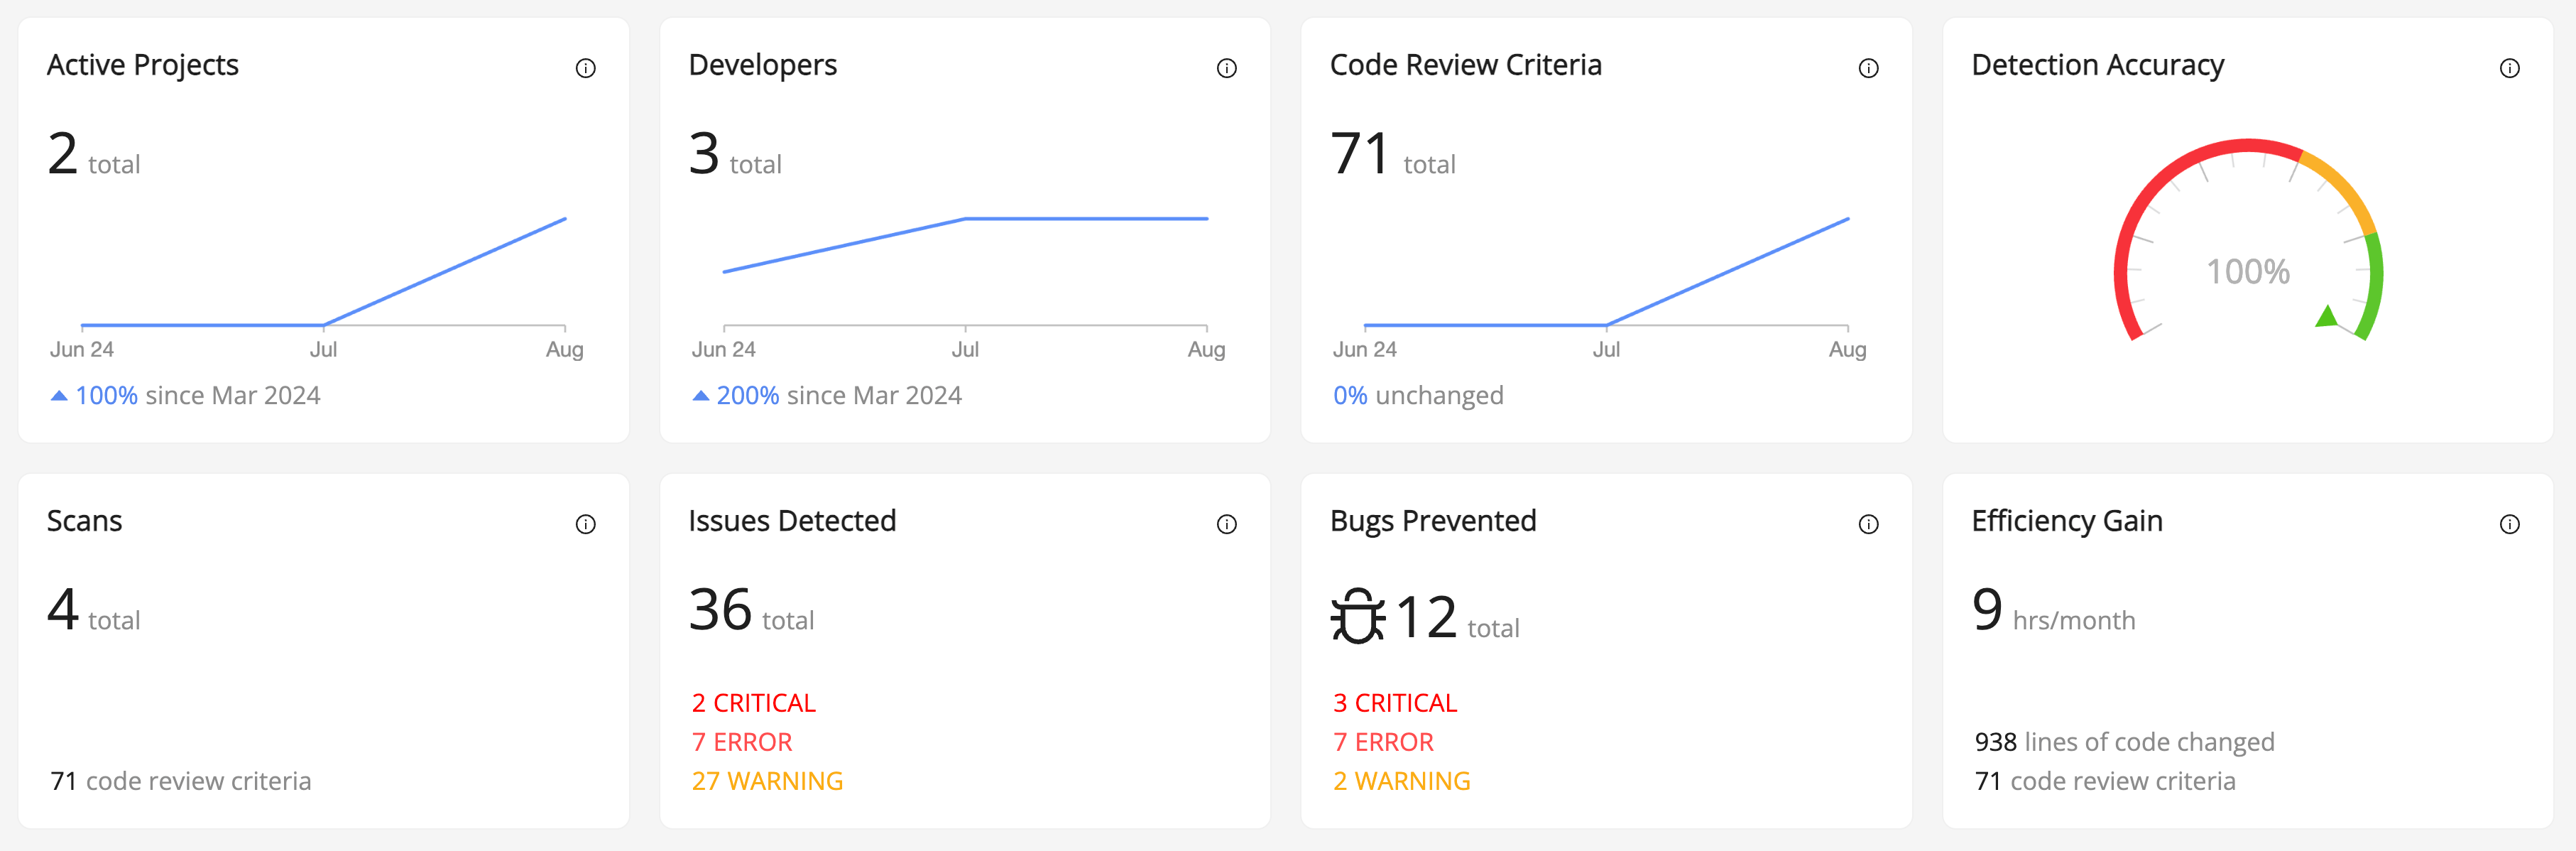
By integrating Clayton from Gearset into your development cycle, code reviews are woven into the overall DevOps process. This gives the whole team an integrated and unified release process, streamlined development and faster code reviews. The number of hours saved each month means engineering teams are able to spend more time building great features and less time fixing errors and security vulnerabilities.
Gearset and Clayton were already well integrated but from now on we will deepen that integration and bring the platforms together. To find out more about Clayton for Gearset, get in touch via in the live chat. If you’re an existing customer, reach out to your account manager to talk more about how Clayton can be added to your current process.
