
As teams scale and applications grow increasingly complex, traditional tracking methods like basic logging or error alerts don’t provide the insight needed to tackle new challenges. Salesforce teams need deeper visibility into their org’s infrastructure and data, proactively identifying issues, quickly tracing failures to their root cause, and resolving bugs — without the stress of scrambling for clues.
To move beyond constant firefighting, you need observability. In this post, we’ll explore how your team can close the visibility gaps in your DevOps lifecycle to build stable, scalable Salesforce orgs.
What is observability?
Observability is a development practice that helps assess a system’s internal state by analyzing external outputs like logs, metrics, and events. In the Salesforce ecosystem, this means teams can go beyond detecting failures and instead understand the underlying causes of why they’re happening in the first place. This proactive insight into system performance creates a continuous feedback loop across the entire DevOps lifecycle, ultimately improving delivery quality and system resilience.
Here are some of the main benefits:
- Earlier issue detection: Identify bugs earlier in the release cycle, before they reach users.
- Proactive problem-solving: Track changes and anticipate issues like hitting governor limits, helping your team address risks during development.
- Improved performance: Gain a comprehensive view of system bottlenecks, helping your org run smoother and faster.
- Enhanced team collaboration: Provide clear, structured data that aligns engineers, admins, and architects around common insights.
For a closer look at how observability empowers Salesforce teams, our whitepaper unpacks its role in ensuring stability, accelerating delivery, and guiding better decisions.
What’s the difference between observability and monitoring?
Monitoring tells you when something breaks a predefined limit — it’s reactive, like an alarm that goes off when something’s gone wrong. You get alerts based on thresholds you’ve set, often for known failure scenarios. If a job fails, CPU spikes, or memory usage crosses a line, monitoring lets you know. It’s invaluable for surfacing immediate symptoms — but it doesn’t always explain the root cause.
Observability, on the other hand, gives you the tools to explore the why. While logs, metrics, and traces are essential components of your observability setup, they often don’t provide the complete picture. Where monitoring points to symptoms, observability helps uncover your system’s internal state: spotting patterns and correlating changes in one part of the system with issues elsewhere. This becomes especially crucial in complex environments like Salesforce, where issues don’t always manifest in obvious ways and can originate in metadata changes, user permissions, automation misfires, or integrations with third-party tools.
Standardizing Salesforce delivery in Manufacturing: Lessons from a release team
Why observability is critical to DevOps
DevOps relies on rapid feedback and continuous improvement — both of which are hard to achieve without visibility into how your systems behave in practice. Observability makes this possible by enabling earlier anomaly detection, faster issue resolution, and more informed decisions.
Observability in DevSecOps
Observability and security are both important to maintain the health of your org, but they each tackle different challenges. Security focuses on proactively preventing threats, managing vulnerabilities, and enforcing compliance to protect your systems and mission-critical data. Rather than analyzing system behaviors, security teams monitor for unusual patterns or breaches, set strict access controls, and continuously assess risks to prevent incidents from occurring.
Observability plays a critical role in DevSecOps because the detailed insights it provides enable teams to detect security anomalies early, streamline incident response, and continuously validate that security controls are working effectively across the entire software lifecycle.
How to implement observability in Salesforce
Salesforce doesn’t provide full visibility out of the box. Debug logs require manual setup and expire quickly, and resource constraints, like governor limits, can terminate transactions abruptly and silently. On top of that, the platform’s multi-tenant architecture further complicates root cause analysis.
That’s why it pays to be intentional about observability. While it’s ideal to design with visibility in mind from the beginning, it’s never too late to improve how you understand and operate your organization’s Salesforce environment. Whether you’re starting fresh or layering observability into an existing setup, the goal is the same: to turn confusing, unexpected failures into explainable, actionable insights. By deliberately designing for visibility, Salesforce teams can spot problems earlier, resolve them faster, and keep their orgs more stable over time.
An effective observability setup for Salesforce depends on a few core practices that give you meaningful visibility into how your org behaves:
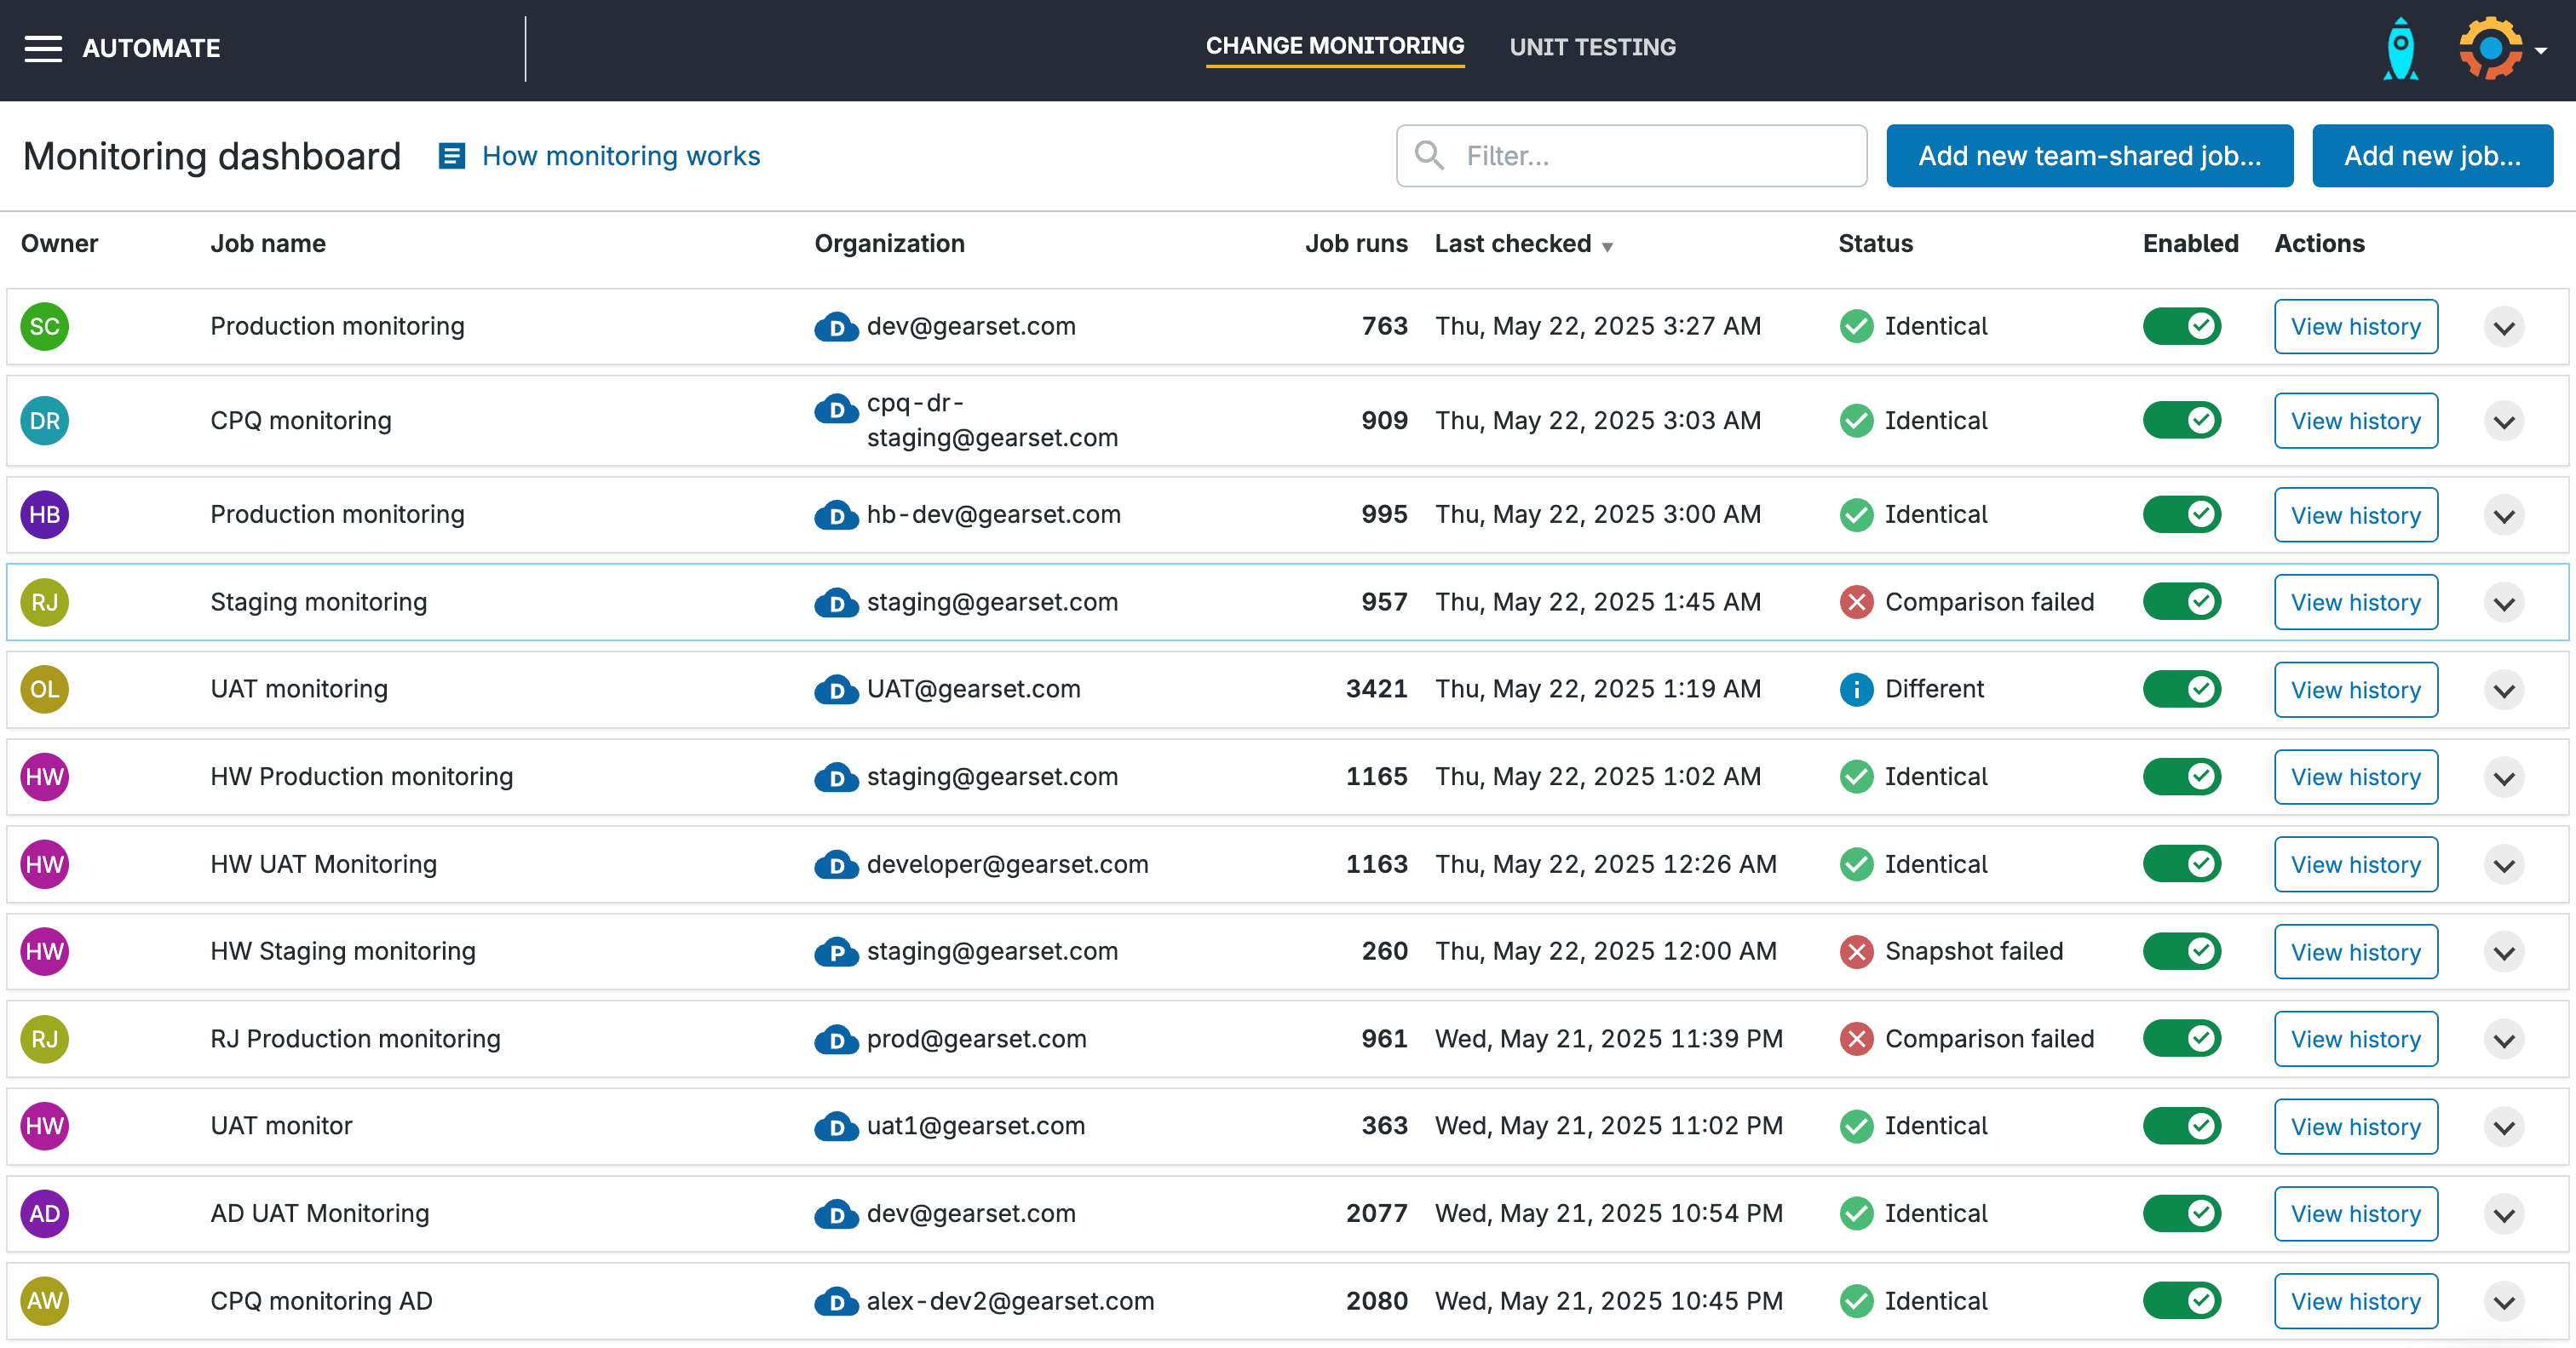
Metadata change monitoring gives teams visibility into config and code changes across environments — including those made outside of standard deployments. Tools like Gearset’s automated change monitoring track and highlight these changes in real time, making it easier to connect bugs or regressions to recent updates.
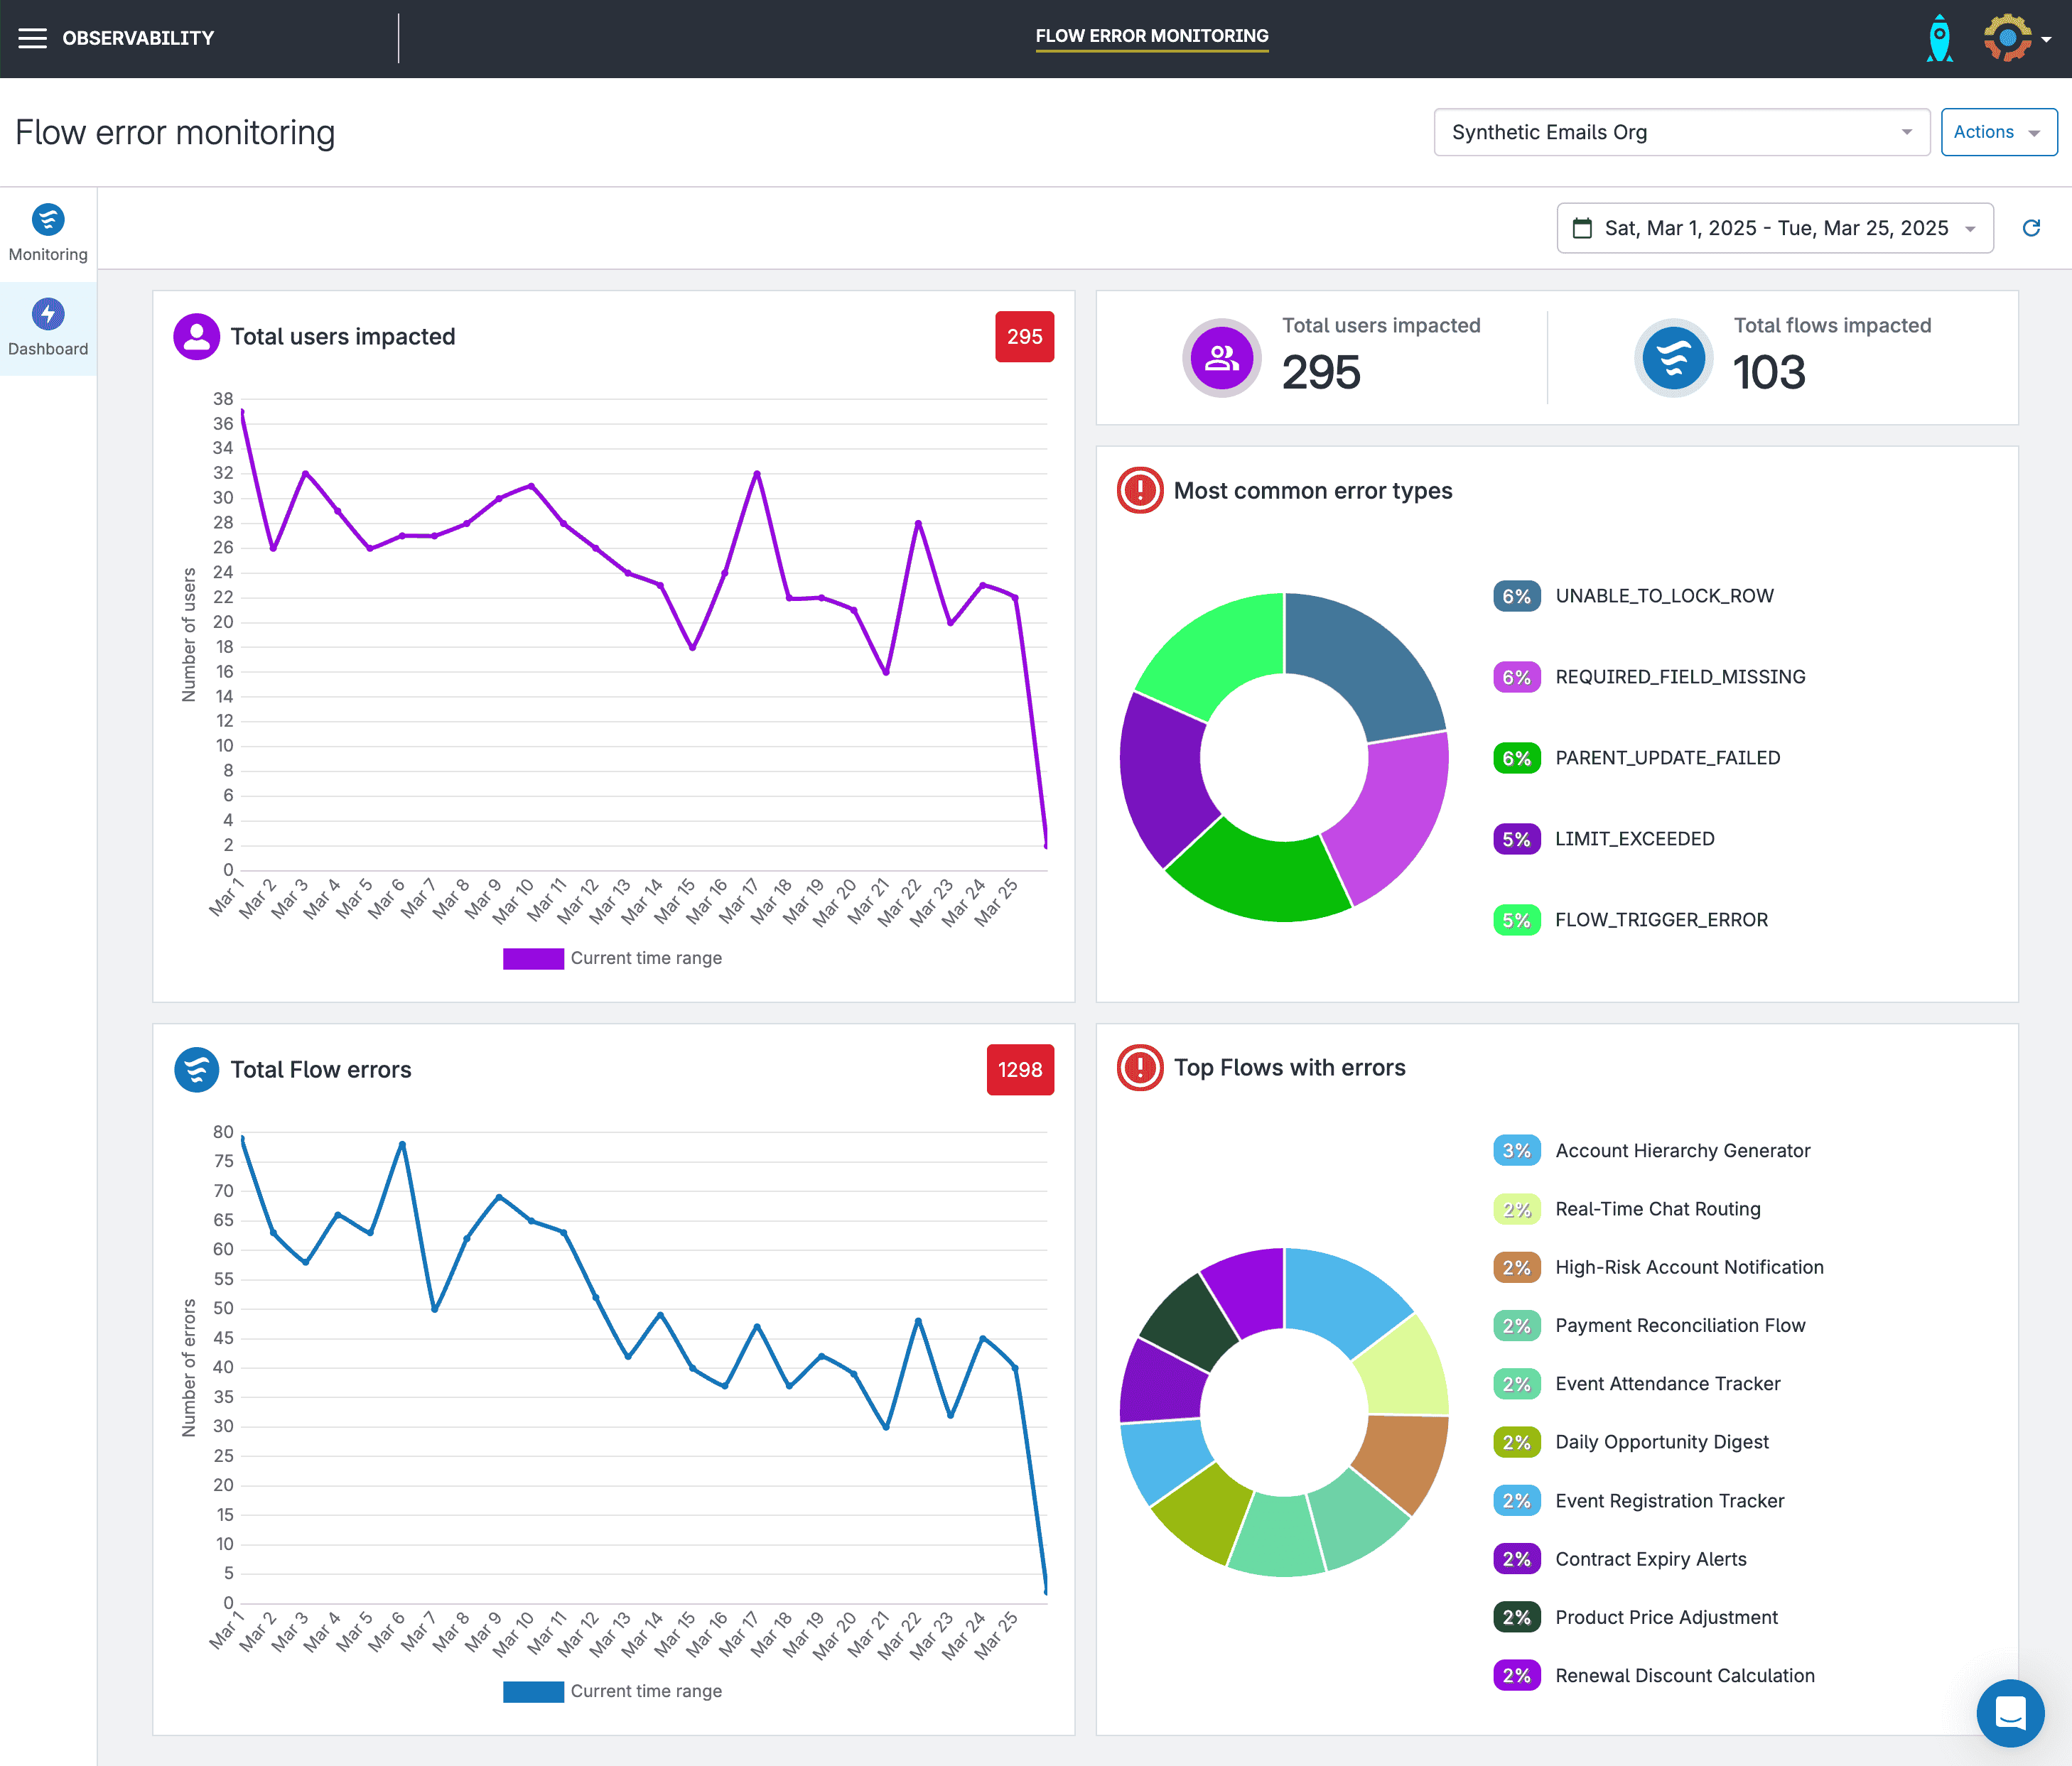
Flow and Apex error monitoring brings exceptions — the runtime issues that cause failures in your automations or code — out of inboxes and into shared dashboards. Rather than relying on scattered error emails, teams get a centralized view of faults with enough context to investigate and fix problems faster.
Gearset’s Flow and Apex monitoring solution connects with Slack and MS Teams so you can receive notifications about any errors directly in your workspace. You can also create custom notification rules, cutting through the noise, so your team only gets notified about the errors that are important.
Event monitoring captures system-level activity like user logins, report exports, and API calls. While Salesforce now offers a free tier of Event Monitoring, it includes only a limited set of events — typically just Apex execution logs and a few basic metrics. Still, it gives teams an entry point into understanding org behavior. When paired with custom platform events, it can help build a more complete picture. For organizations that need to be more proactive, Salesforce Shield offers Real-Time Event Monitoring with access to a much broader range of events and immediate visibility.
Structured logging adds rich context to your org’s runtime behavior. By embedding logs directly into Apex code and automations, you can capture inputs, decision points, variable states, and outcomes in a consistent, machine-readable format. This makes it much easier to confidently trace even asynchronous processes like Batch Apex jobs.
Tools like Nebula Logger support structured logging with levels, platform events, and custom metadata — storing logs as records you can easily query and analyze in Salesforce. However, getting the most out of it does require some setup. You’ll need to add logging statements to your code to capture and record the relevant errors and events.
When these practices are in place, they provide the foundation for an observability process that turns system behaviour into signals you can understand and act on. Instead of chasing symptoms and sifting through vague errors, your team can move quickly from detection to diagnosis to resolution — with less guesswork and more confidence.
Best practices for Salesforce observability
You don’t need to overhaul your entire process to start seeing the benefits. Begin small and scale up. Even a few targeted improvements can make a real difference. For example:
- Introduce structured logging into new code as it’s written
- Set up a centralized Flow error monitoring system
- Ensure visibility of metadata changes between environments
- Track resource usage in batch jobs to spot trends early
As these practices become part of daily development, the insights they generate make it easier to prioritise what to improve next. Here are some best practices to keep observability effective and manageable as you scale.
Monitor what’s important
Not every process needs deep visibility. Start with business-critical Flows, high-risk automation, and areas that are prone to causing issues. Look for what breaks most often, or what would have the biggest impact if it did. Observability is most effective when it’s tied to the parts of your org that matter most to end users and to your team.
Set up alerts for critical events only
Avoid alert fatigue by only triggering notifications for high-severity or high-impact events. Use threshold-based rules to filter out low-priority noise and make sure alerts land with the right people — whether that’s in Slack, MS Teams, or another channel. Consider grouping similar alerts together or adding context (like recent changes) to help teams respond faster.
Define key metrics
Define a focused set of metrics that actually help you spot problems and understand data trends. This could include CPU time usage, heap size, SOQL query counts, Flow fault rates, or error volumes across specific business processes. The goal is to capture enough data to inform decisions — without overwhelming teams with irrelevant stats.
Regularly review your observability set up
As your org changes, so should your setup. Review your logging, alerting, and monitoring strategies on a regular cadence — especially after major releases or architecture changes. Prune outdated rules, refine noisy alerts, and identify blind spots. Make observability reviews part of your DevOps process or platform health checks.
Visualize your data
Dashboards make it easy to see what’s changing, where bottlenecks are forming, and when something is heading off track. Visualising these trends in a dashboard helps teams move from reactive triage to proactive planning. Using a tool like Gearset’s data dashboard gives you a long-term view of data growth and system performance, turning raw metrics into actionable insights your whole team can work from. Dashboards like this also support cross-team alignment by giving everyone a shared source of truth.
Share observability insights across teams
A strong observability setup helps everyone answer the question “what changed?” without hours of manual digging, making root cause analysis faster, and rollback decisions easier. When insights are shared between developers, admins, testers, and platform owners, problems get resolved faster — and with fewer assumptions.
Measuring the success of your observability platform
Observability is only useful if it helps your team make better decisions and respond faster to problems. To do that, you need to track a focused set of metrics that reflect how your system is behaving — and whether the changes you’re making are actually improving it.
- Error rates: Track unhandled exceptions, Flow faults, failed deployments, and user-facing errors. Monitoring these metrics helps surface regressions early and pinpoint areas where system stability is degrading.
- Resource usage: Monitor Apex CPU time, heap size, SOQL query volume, and DML operations — especially in automation or batch jobs that are likely to scale with data growth. Tracking resource usage helps spot processes that are at risk of hitting governor limits.
- Performance timings: Measure how long key processes take to complete, including Flows, Apex code, and third-party integrations. Spikes in response times can signal performance bottlenecks before users report them.
- Storage growth: Watch how data volumes change over time. Tracking object-level trends helps you predict when architectural changes or archiving strategies may be needed.
- Change Failure Rate (CFR): CFR represents the percentage of deployments that result in production failures or incidents. It’s a key DevOps metric for understanding the impact of change. Observability supports CFR by making it easier to connect bugs to the deployments that introduced them, speeding up root cause analysis, and enabling better rollback decisions.
Together, these measures create a baseline of system behaviour, making it easier to detect, diagnose, and resolve issues quickly. Without that visibility, the hidden cost of degraded performance, delayed releases, and inefficient troubleshooting can escalate fast — draining time, money, and momentum.
Observability is the foundation for resilient DevOps
Successful DevOps relies on fast, reliable feedback loops — and observability is what makes them possible. The increased visibility into your processes can transform runtime behavior into actionable insights, helping teams improve stability, reduce downtime, and adapt confidently to changing business needs.
With observability in place, your team can move from reactive problem-solving to proactive performance optimization — spotting issues before they escalate, and making informed decisions based on real data.
To go deeper on how to implement observability in Salesforce, explore our Observability Whitepaper. The whitepaper covers common visibility gaps, practical solutions, and how leading teams are making observability a core part of their DevOps process. Get your copy today!
